Project Ball Magic
Computer Vision for Football Technique Analysis
We built a Proof of Concept (PoC) for a computer vision system that evaluates football technique. Given a video of an athlete performing a training drill, the system analyses movements and ball contacts to calculate a score across different categories. This PoC shows the potential for a new class of future sports apps: fully automated video-based training companions that gamify individual training and offer a cost-effective solution for the masses.
Under the hood, we use YOLO11, a state-of-the-art object detection model, to detect and track both the athlete and the ball. With this information, we can derive real-world positions, distances, speeds and accelerations that are used for calculating our performance scores. This PoC was developed using the feedback from numerous domain experts.
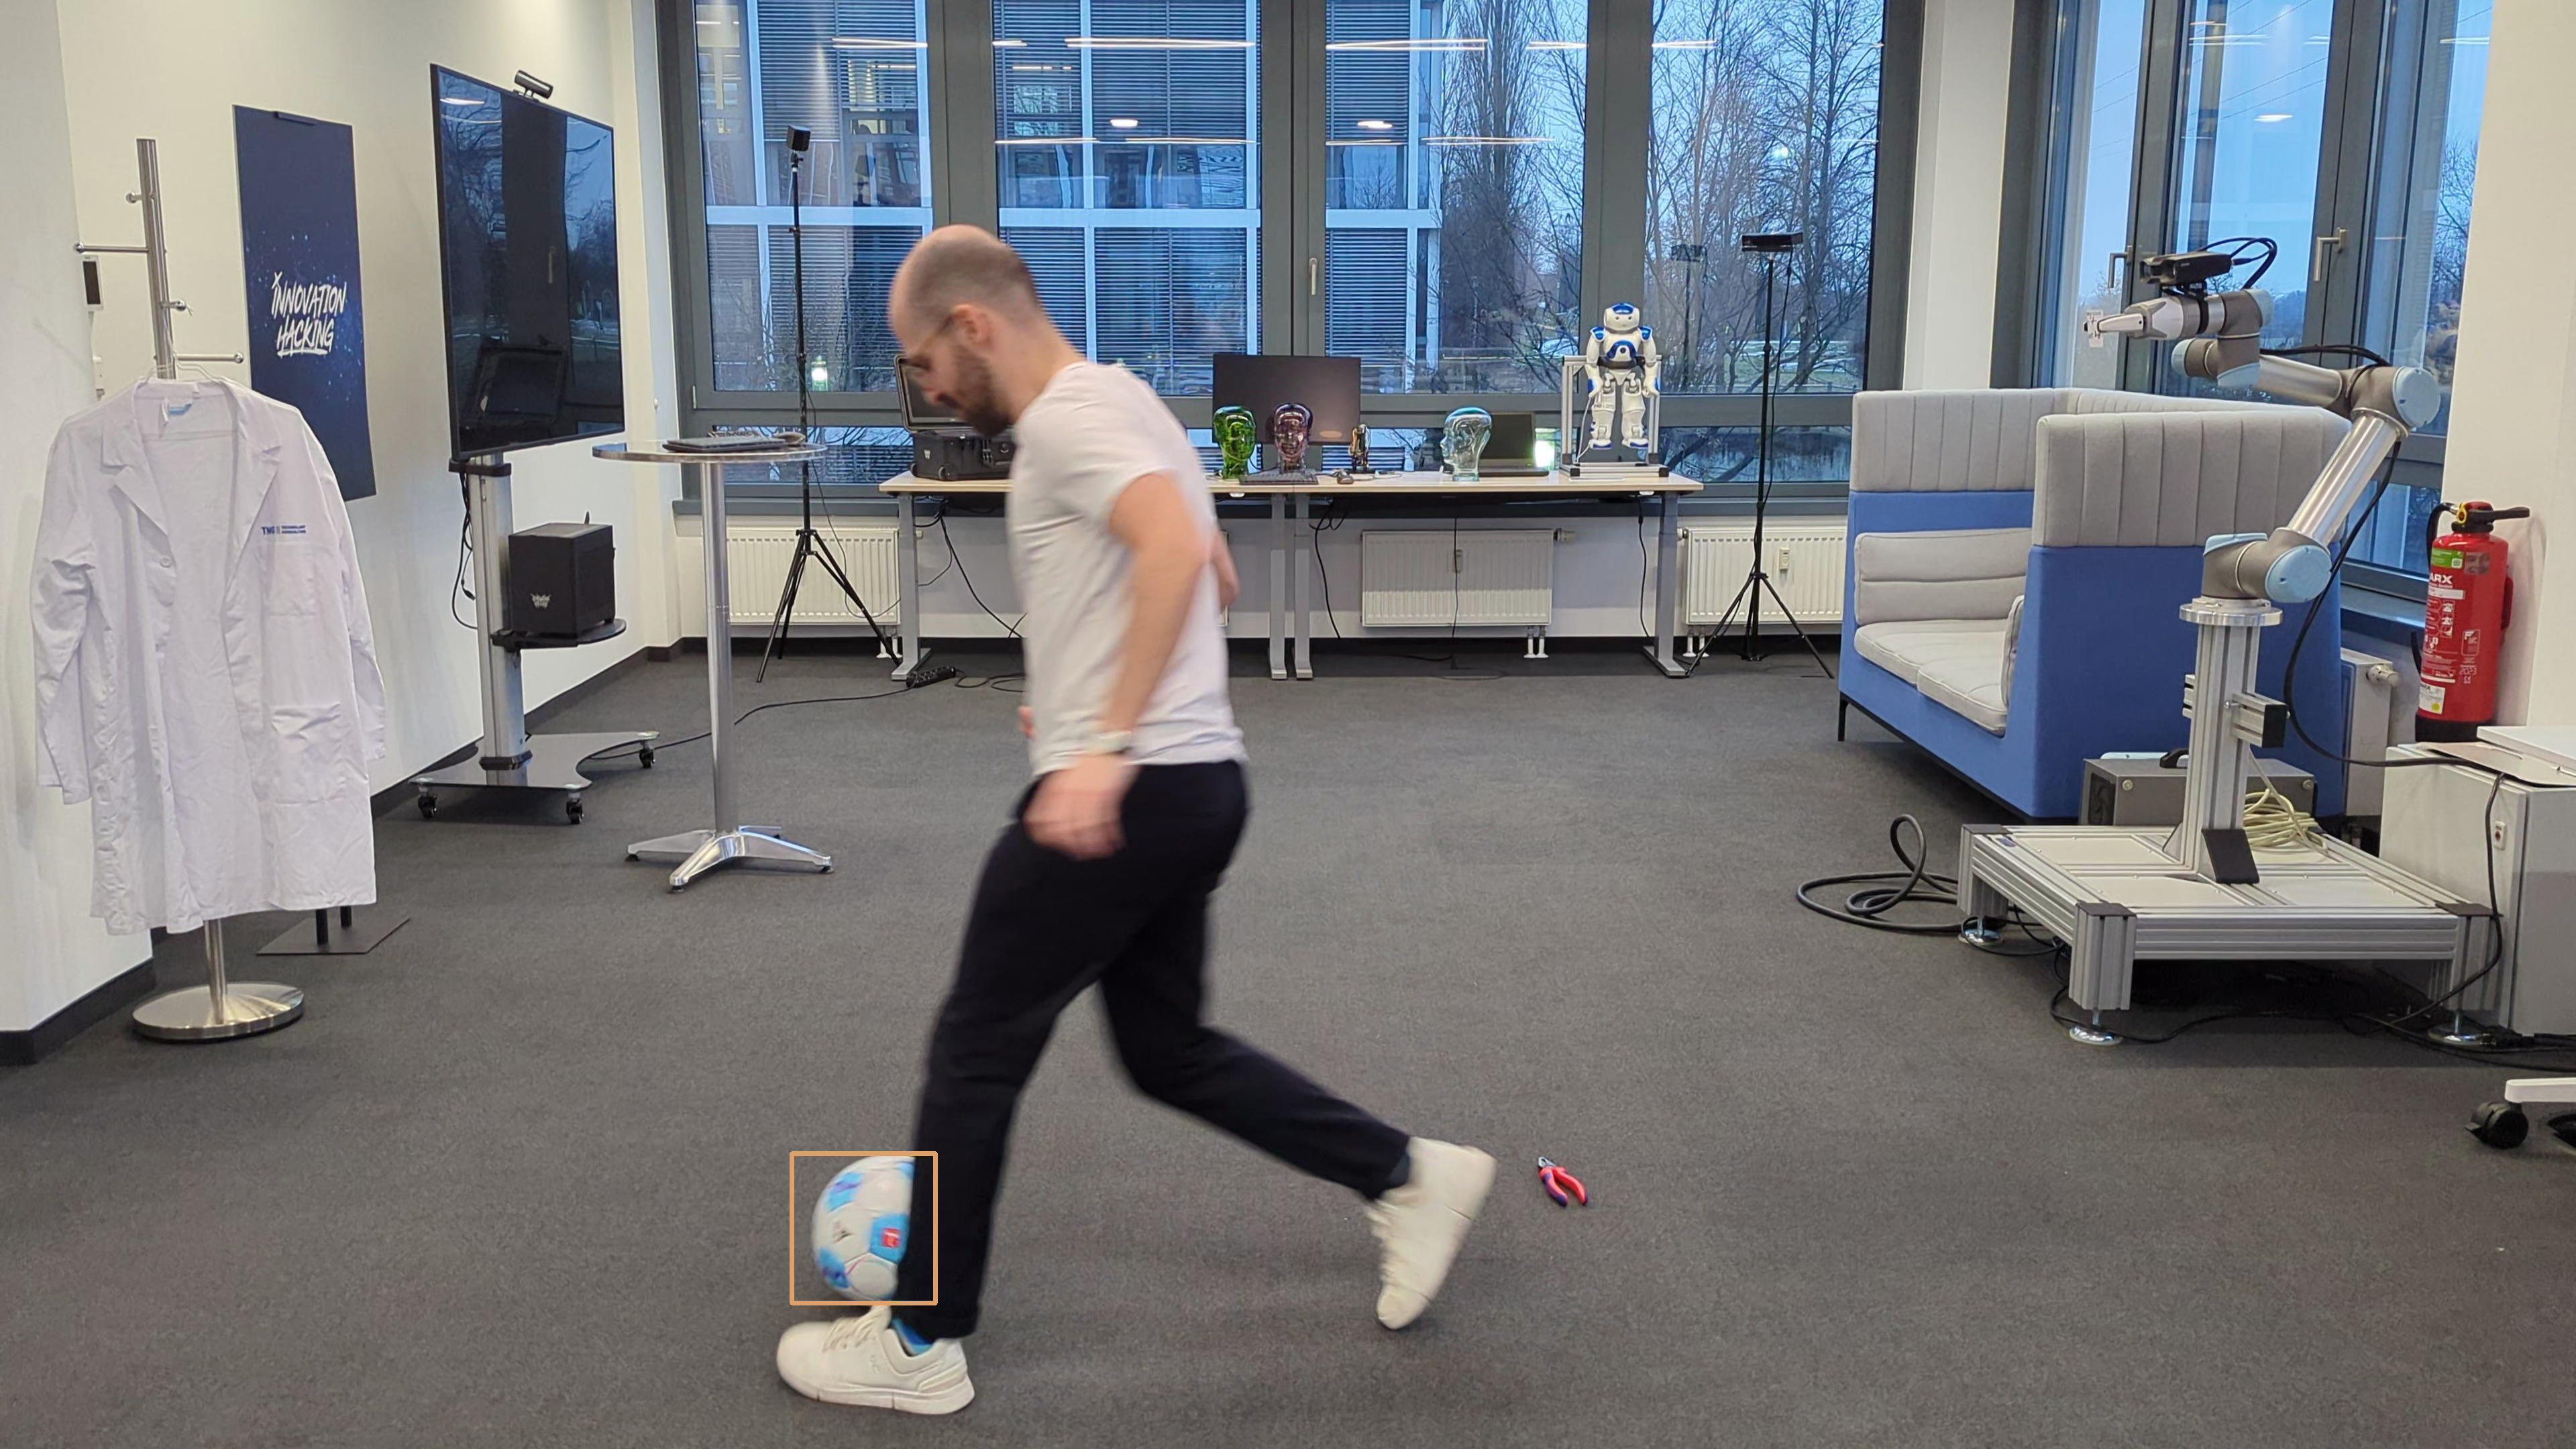
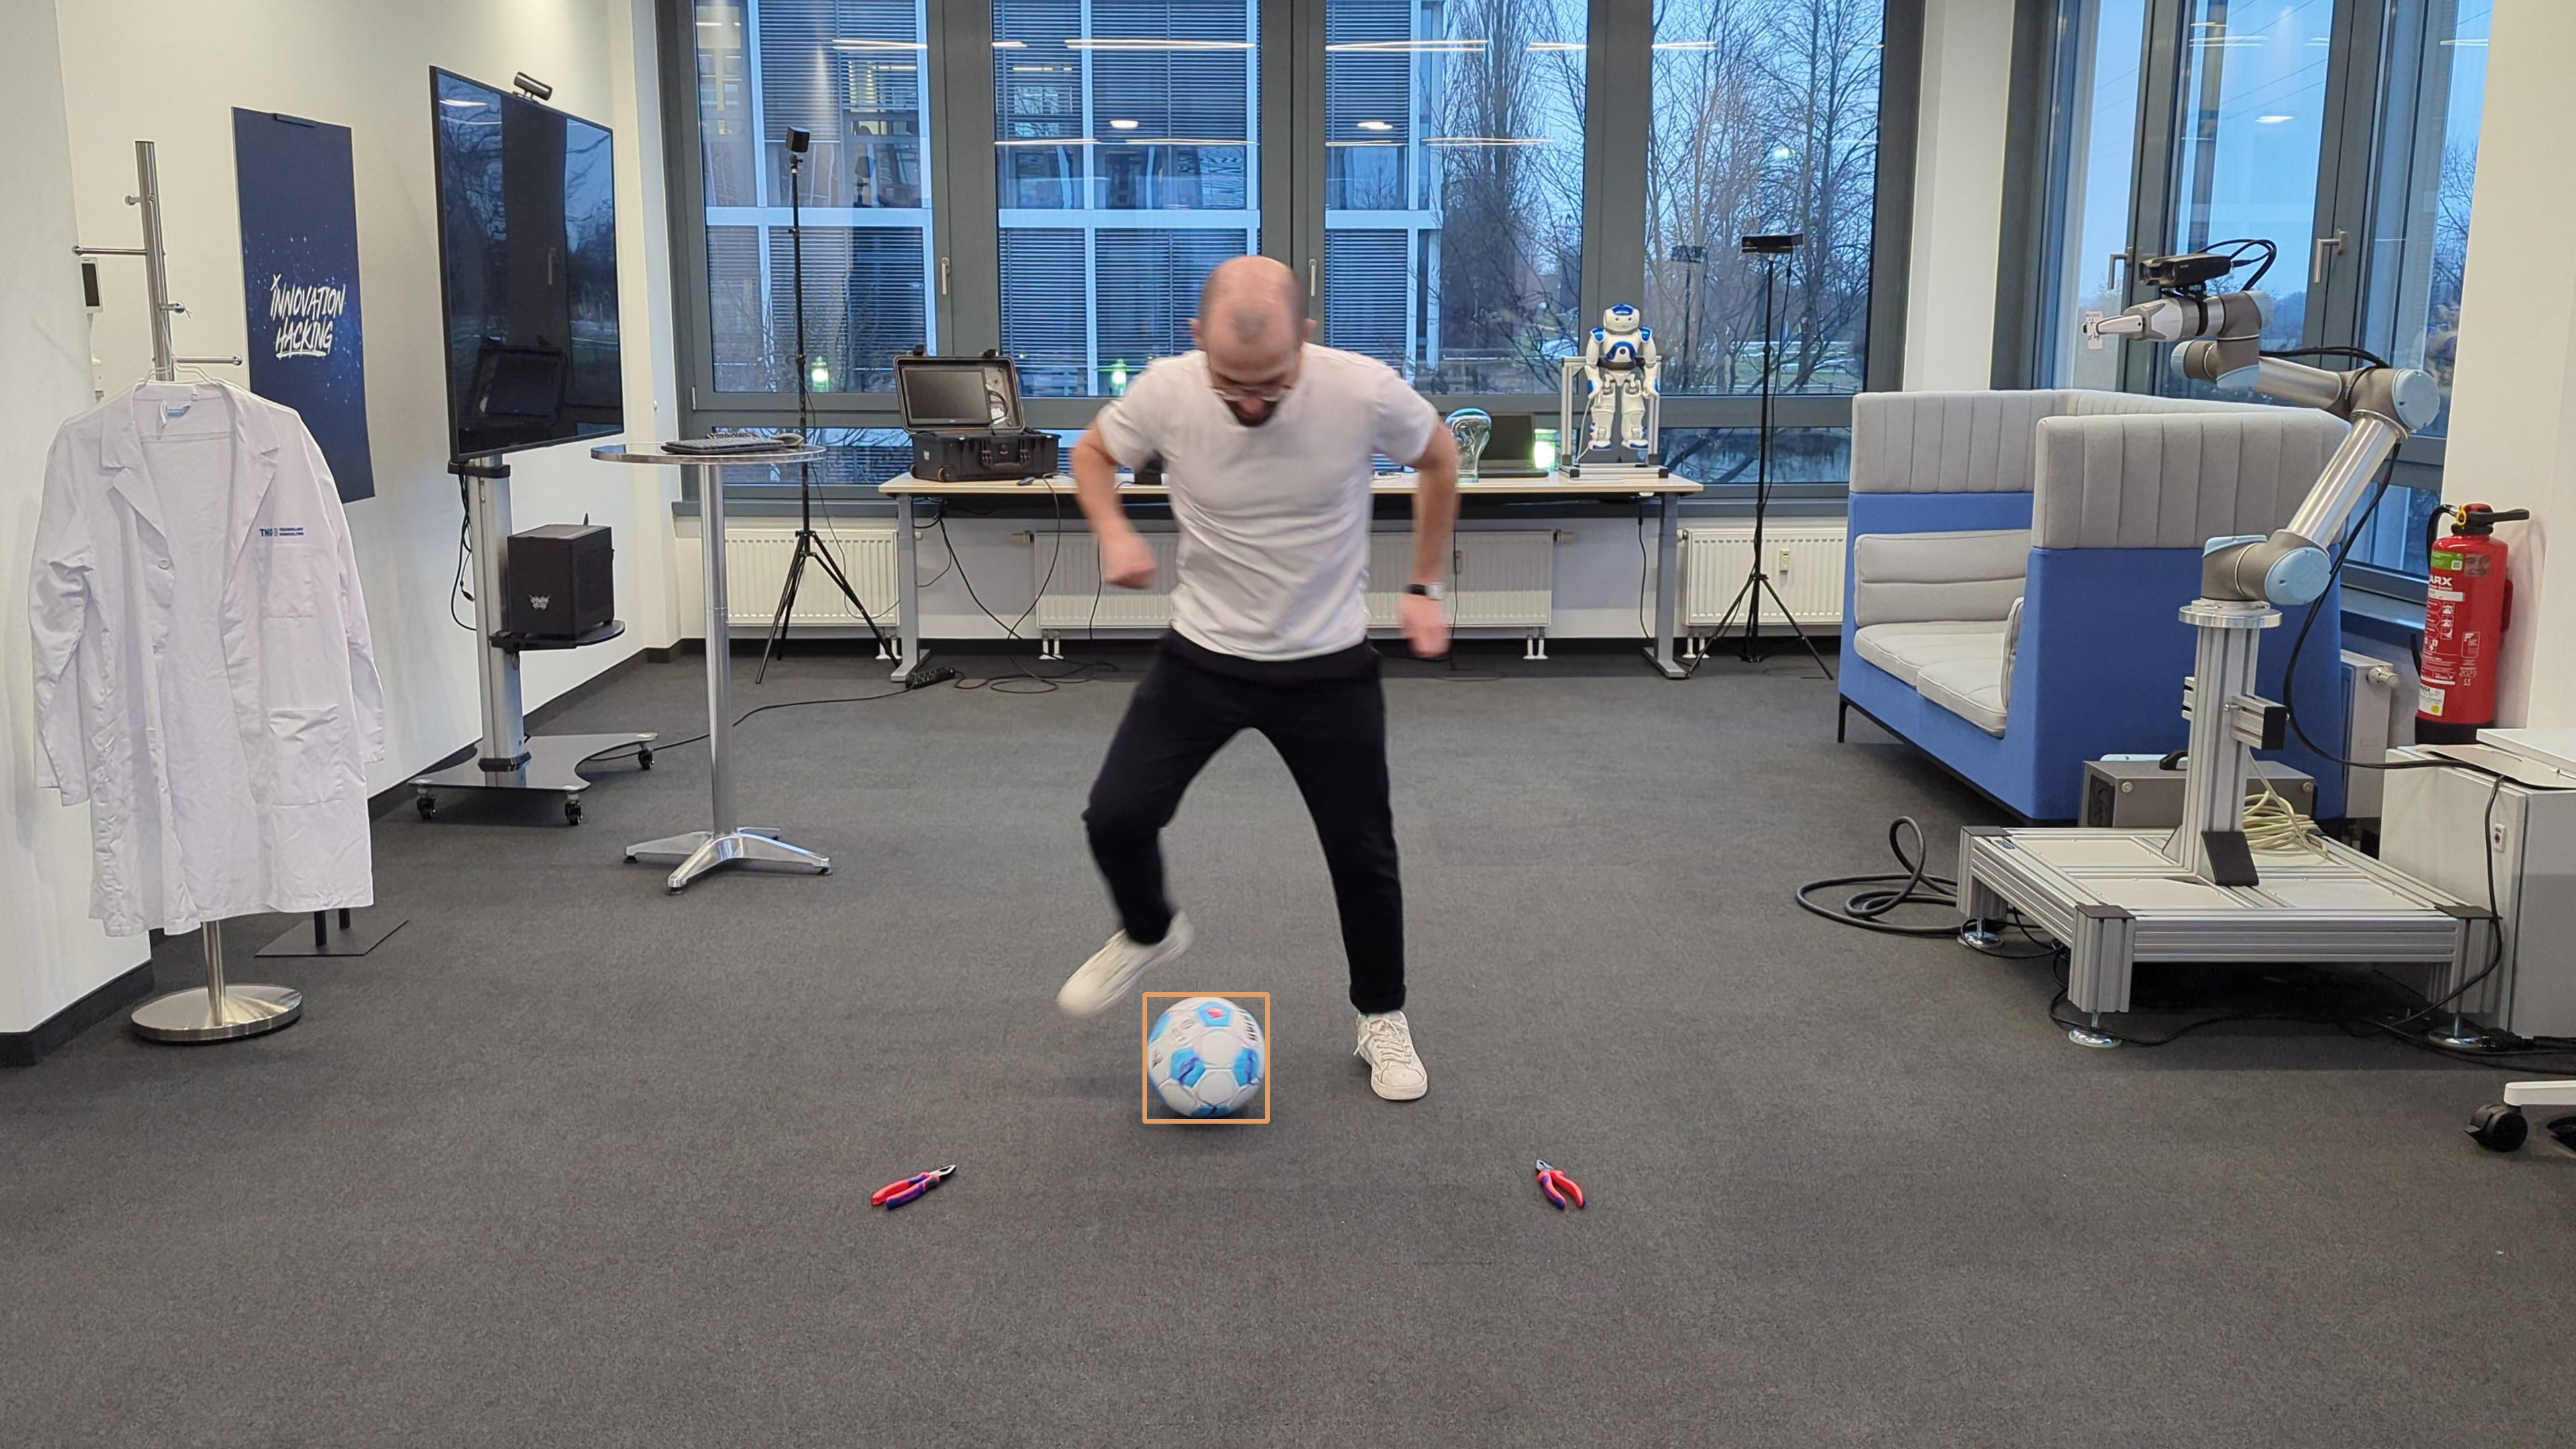
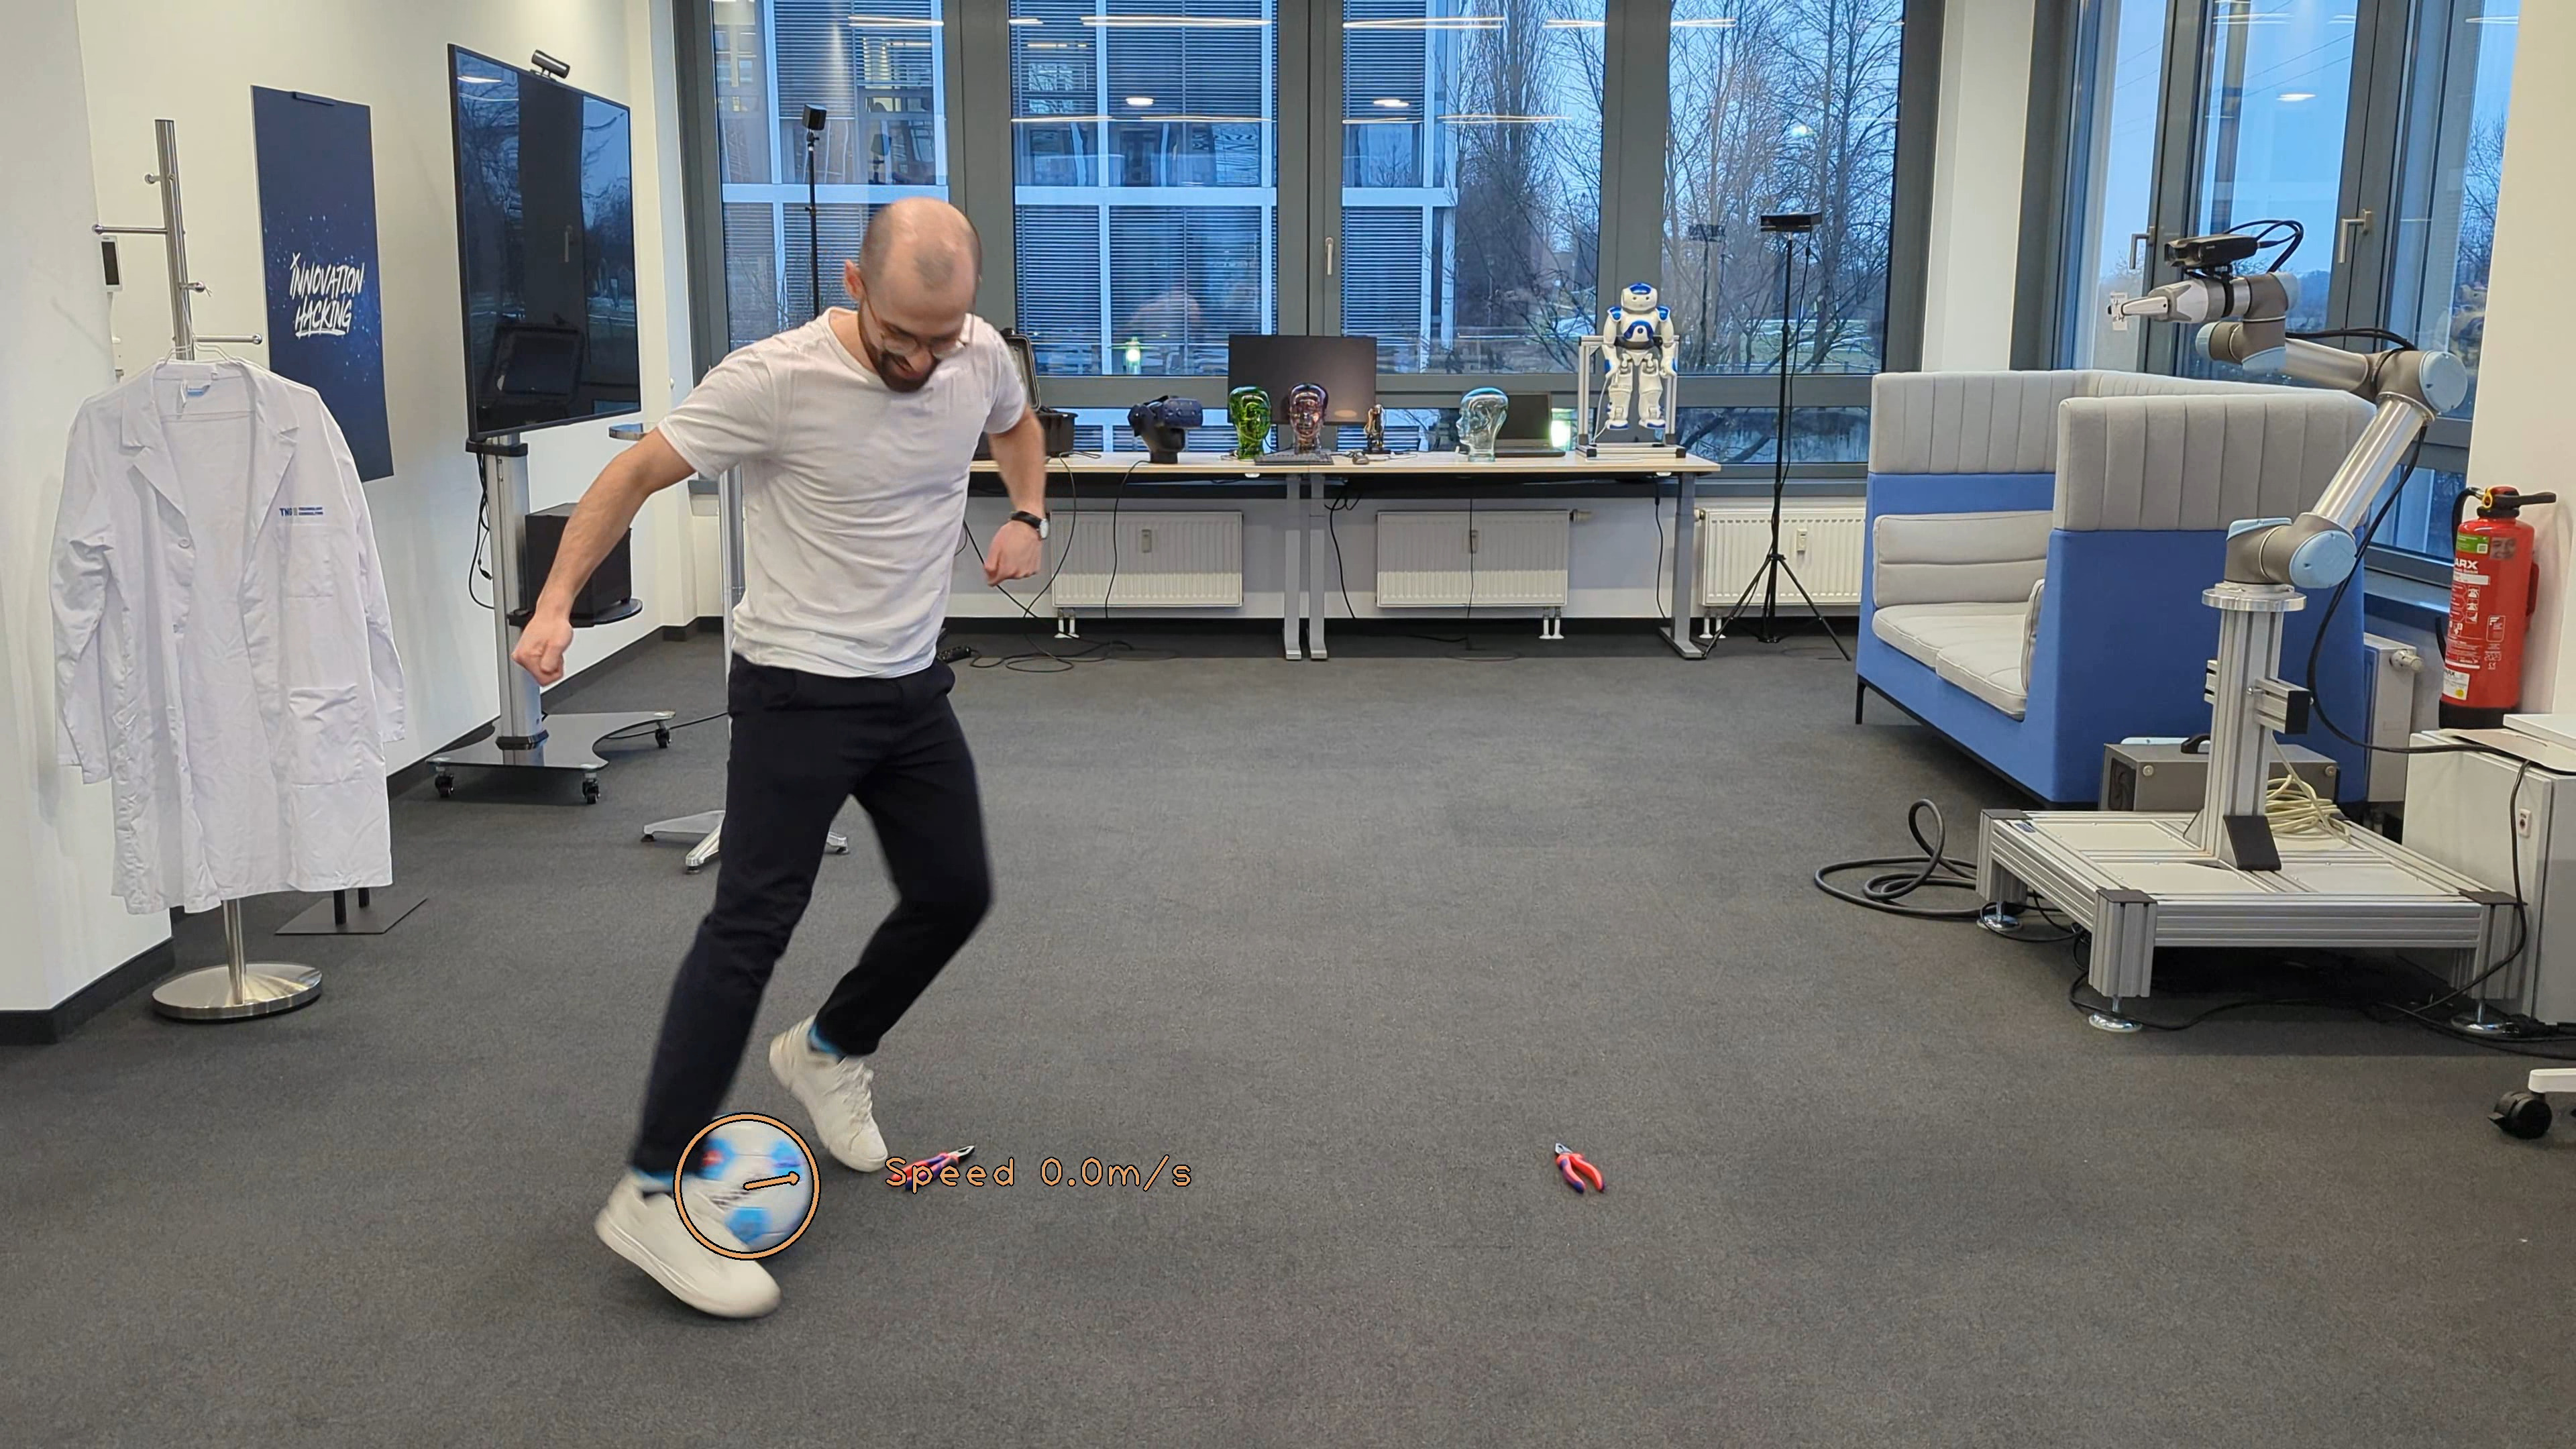
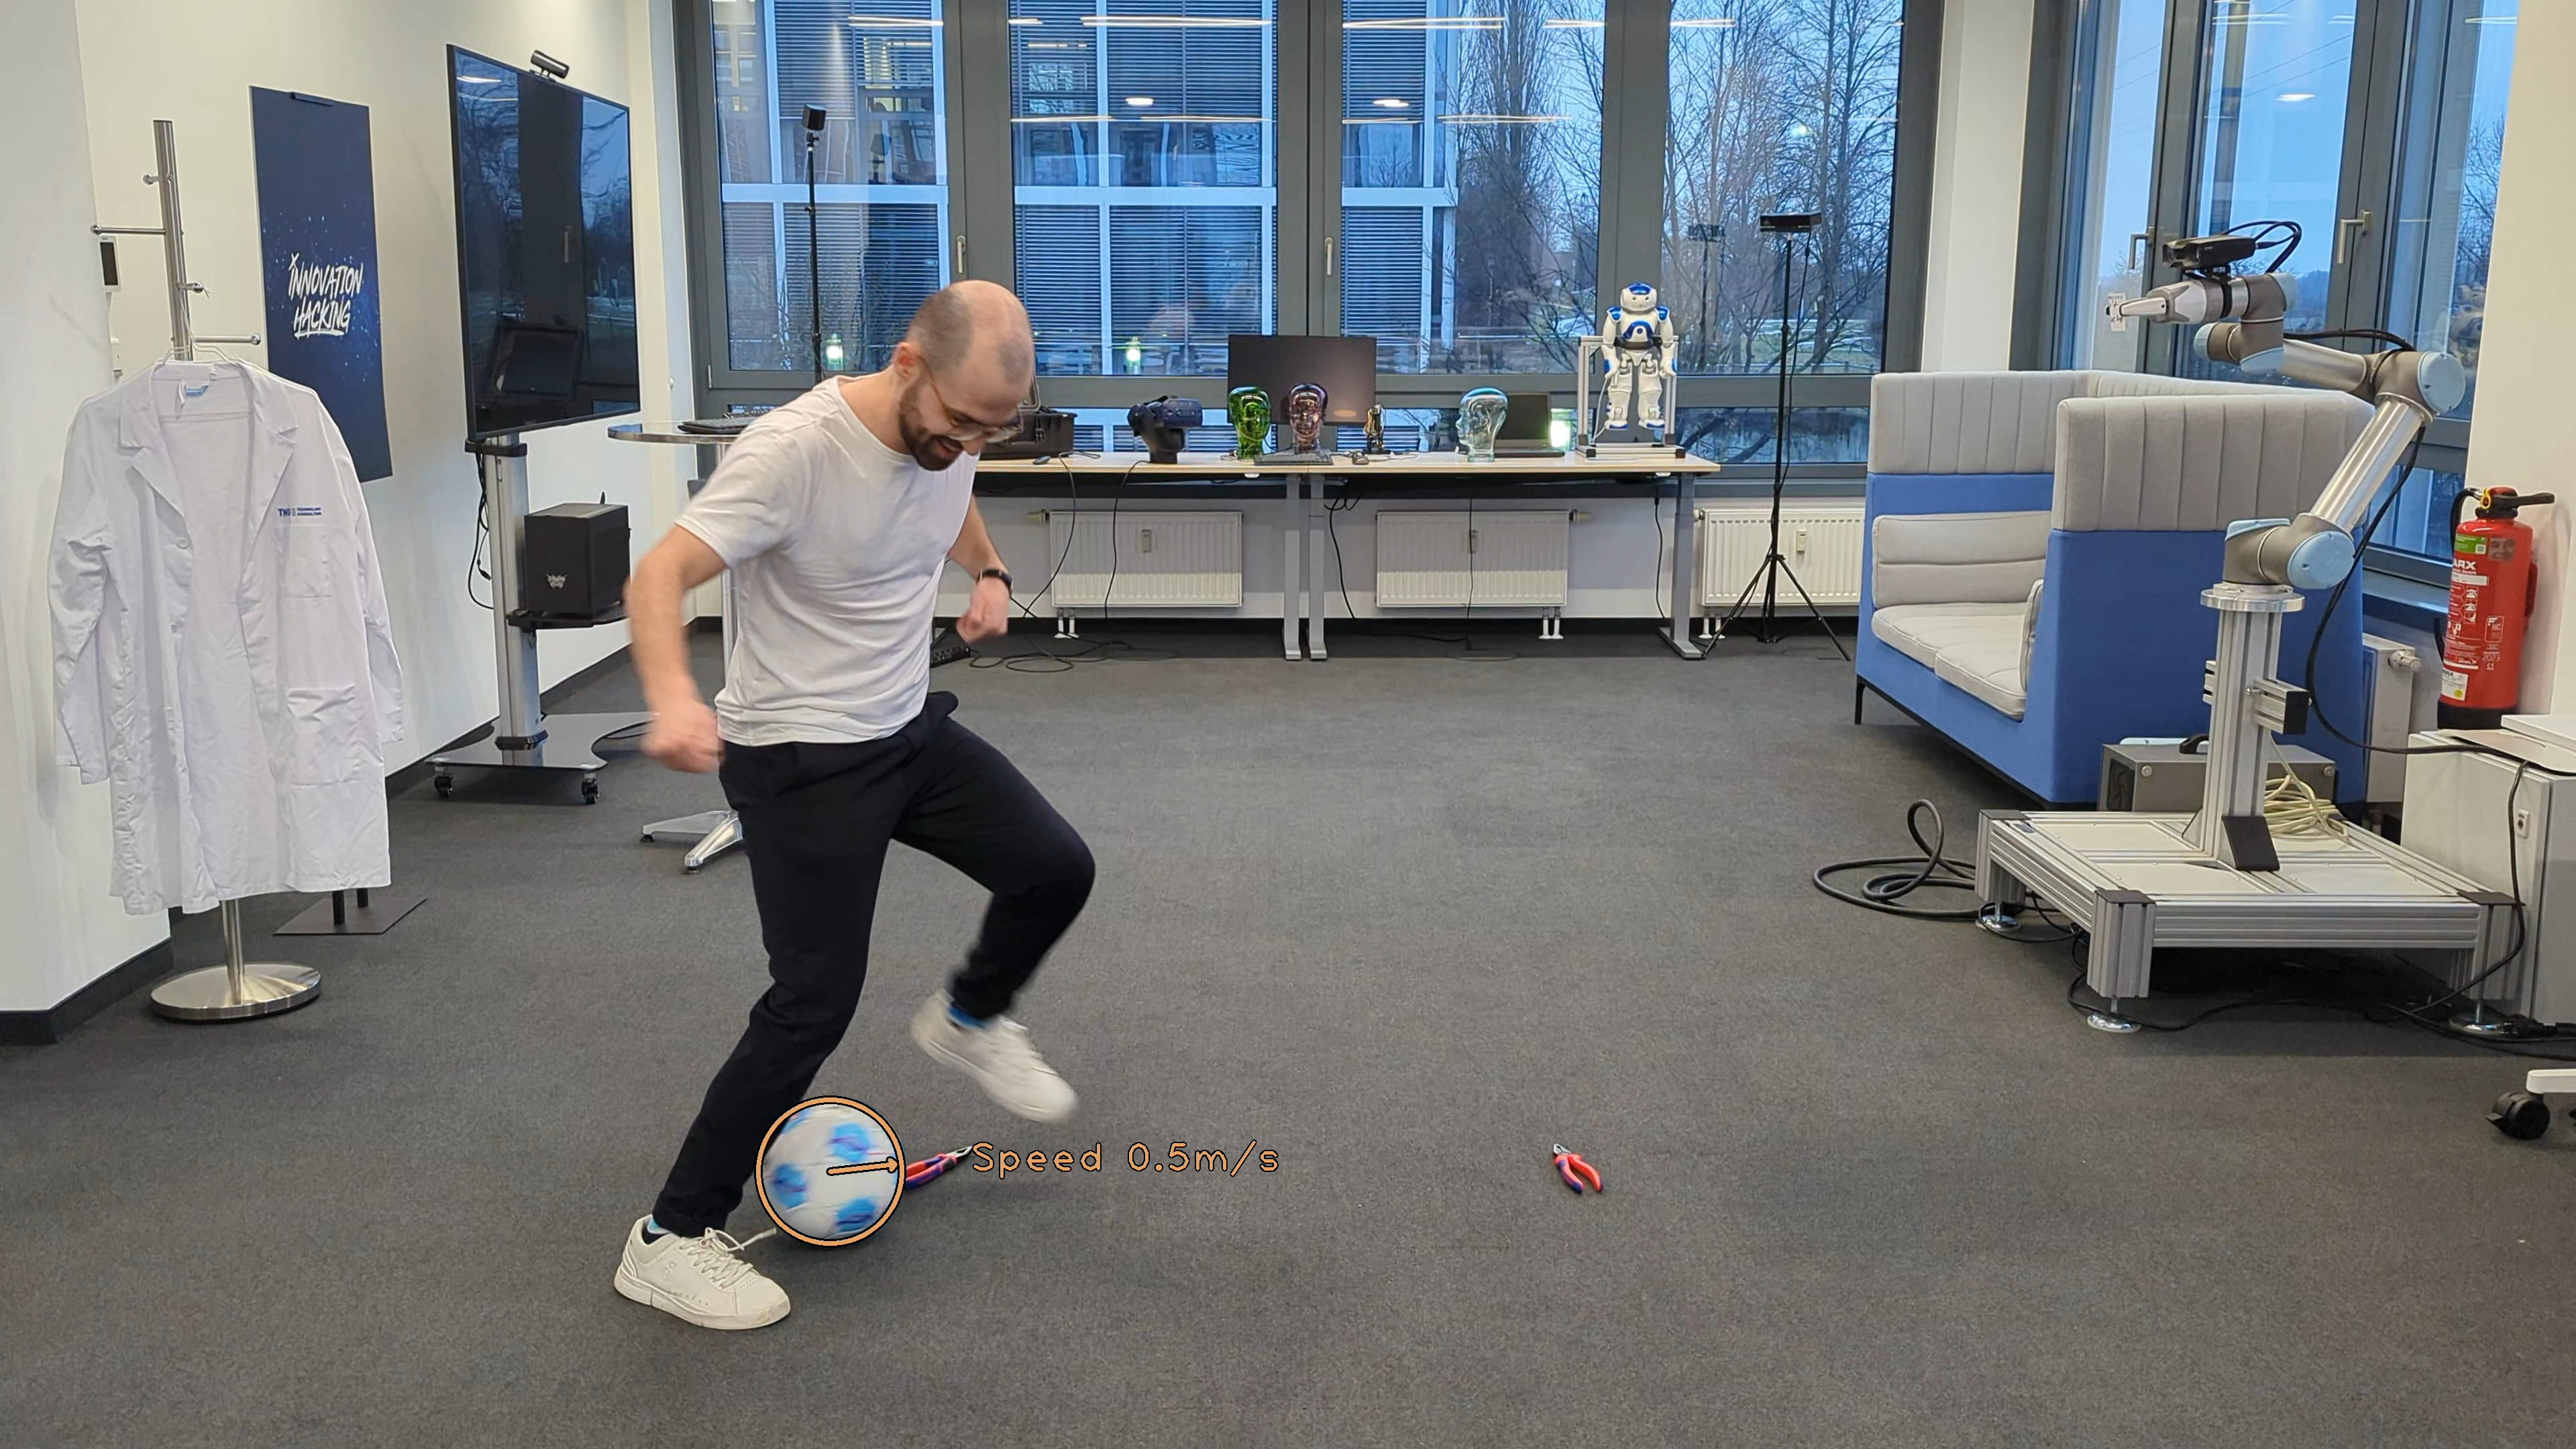
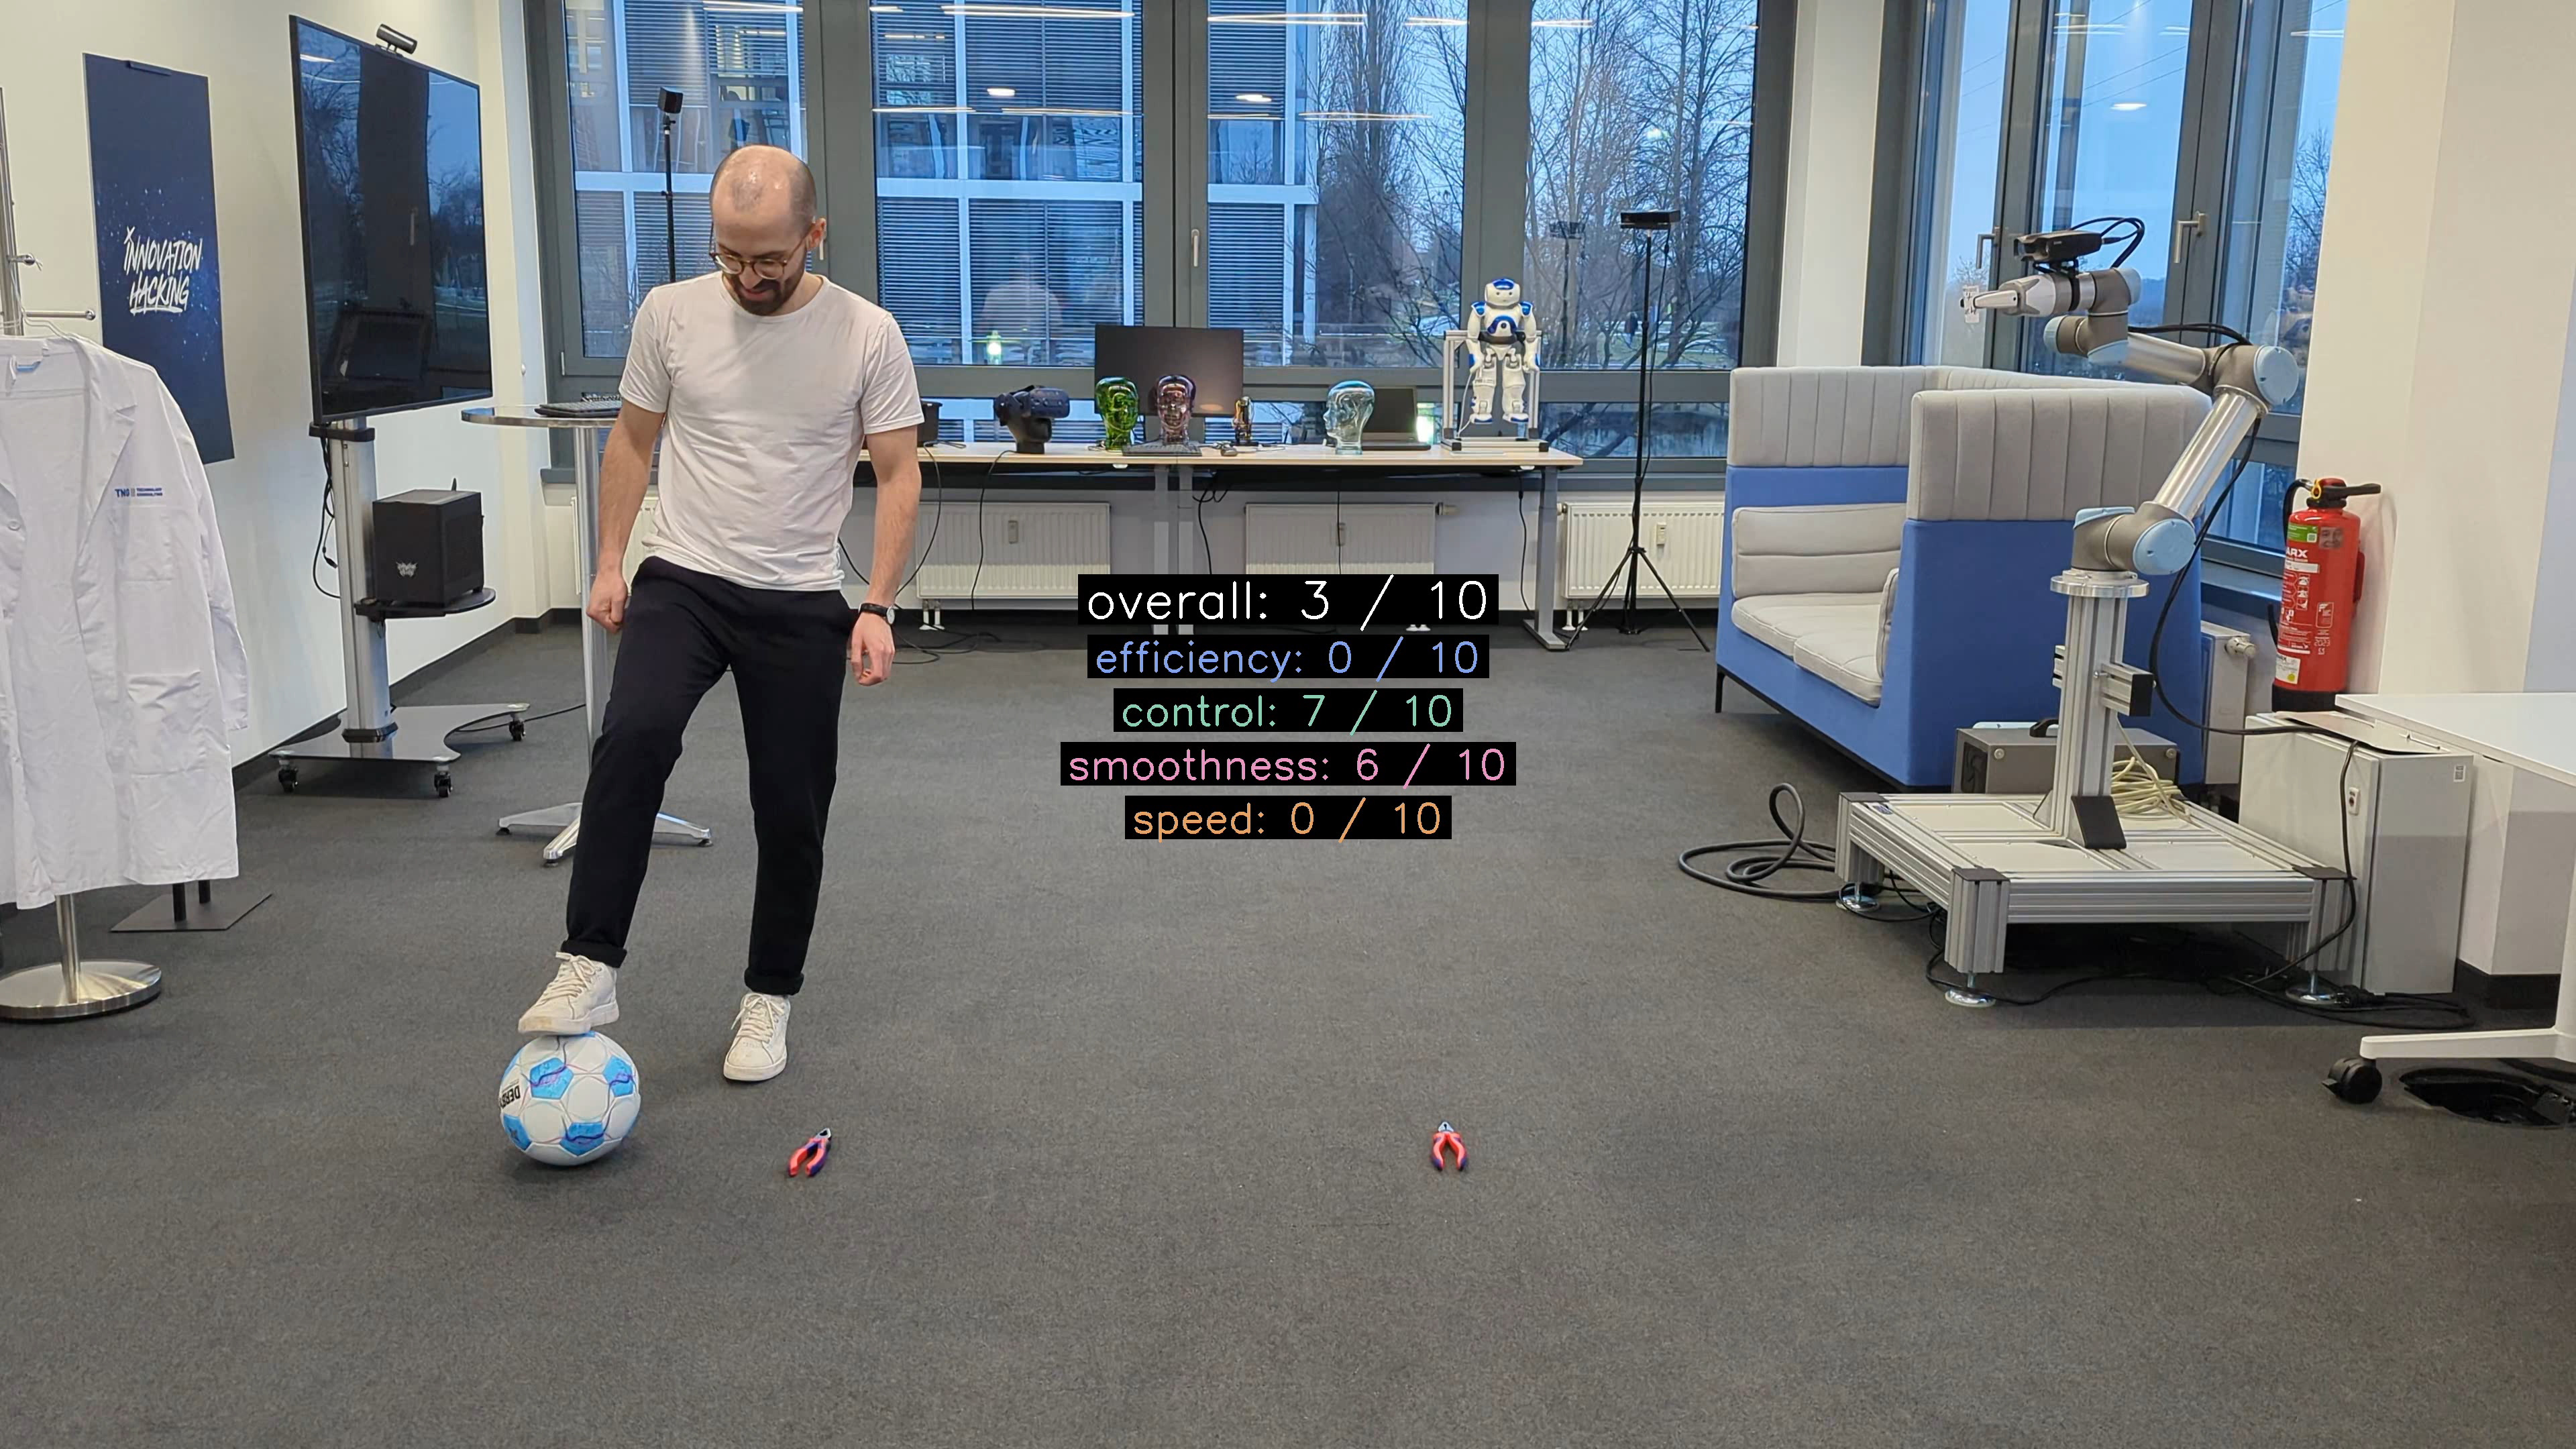
Our PoC is specialised on one particular drill: the Elastico Tip-Tap. Given a video that shows the exercise from start to finish, we calculate scores on a scale of 1 to 10 for the following categories: Speed, Efficiency, Smoothness and Control. Let’s have a look at one example run from our resident football aficionado Daniel Hirsch:
A Look Under the Hood
In the first step, we take advantage of the vast capabilities of Ultralytics’ YOLO11 ecosystem to acquire all of our needed raw vision data:
- Detect footballs in every frame of the video using the yolo11 object detection model. This gives us an axis-aligned bounding box for each ball. Using the ByteTrack object tracker, we match footballs across all frames of the video. This allows us to track the position and movement balls throughout the video. The tracking works most of the time; occlusions and sudden changes in speed can, however, lead to tracking failures. Consequently, we might end up with a more than one trajectory for the same ball.
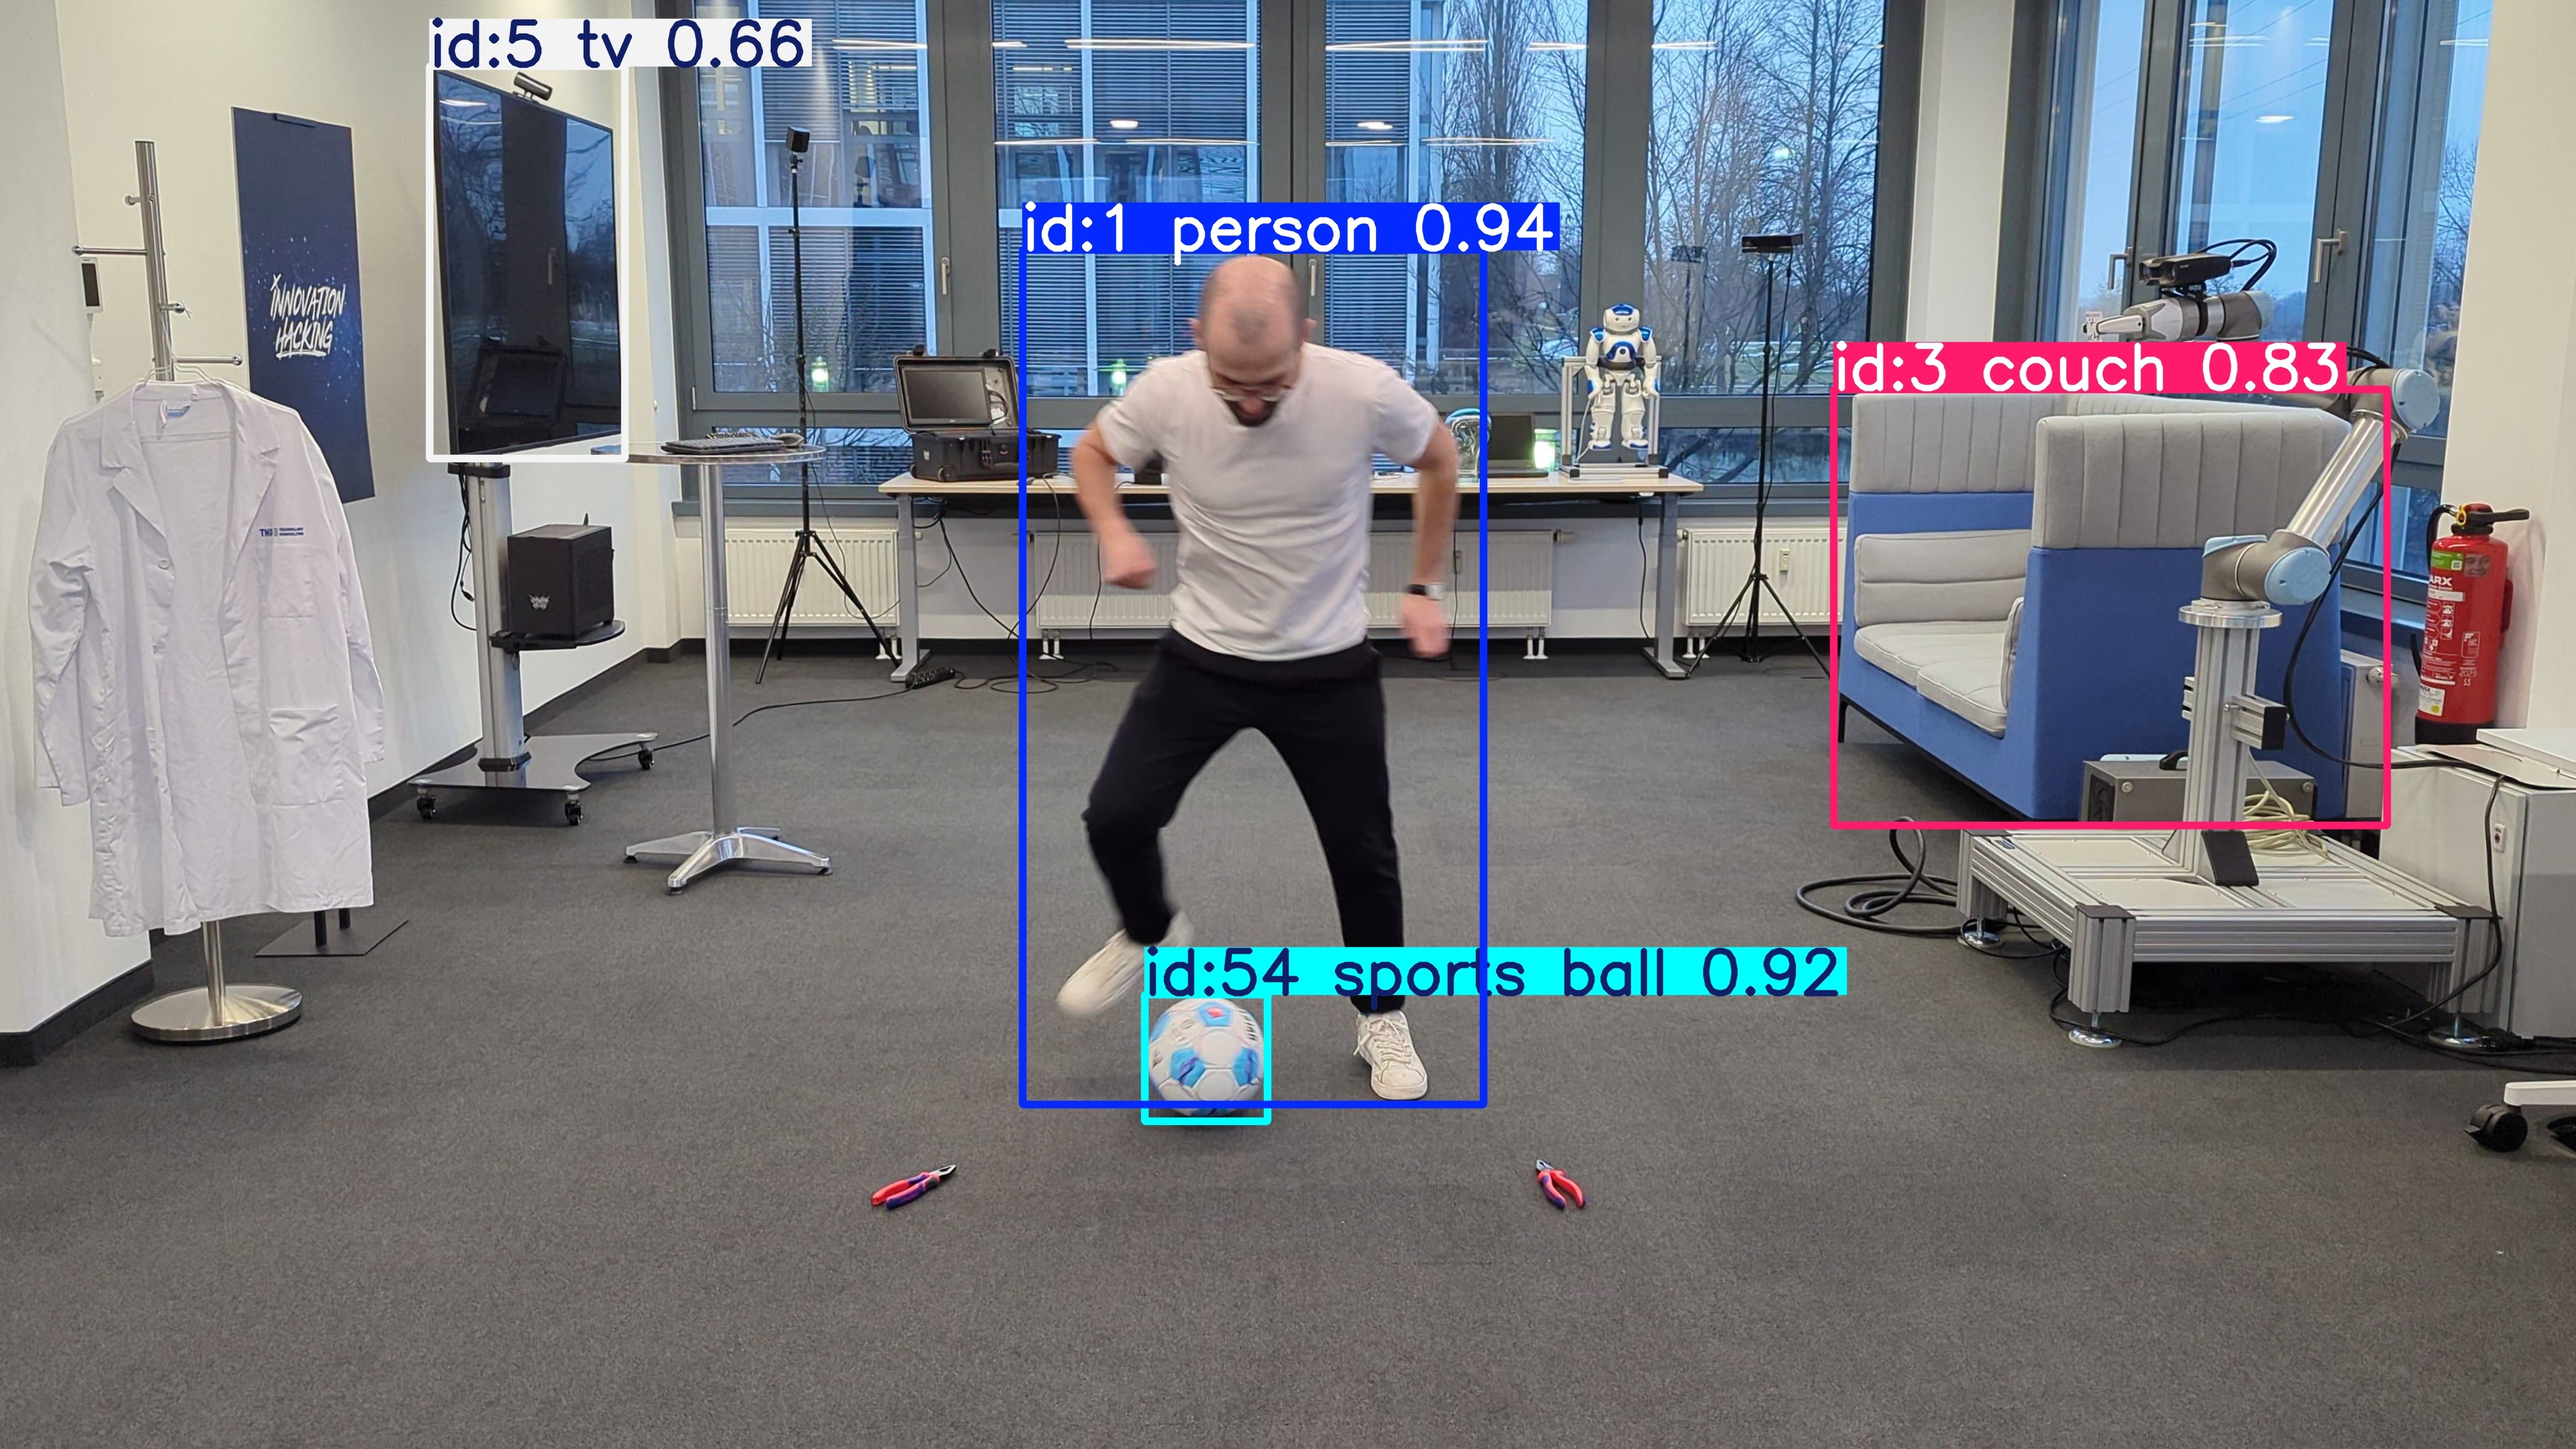
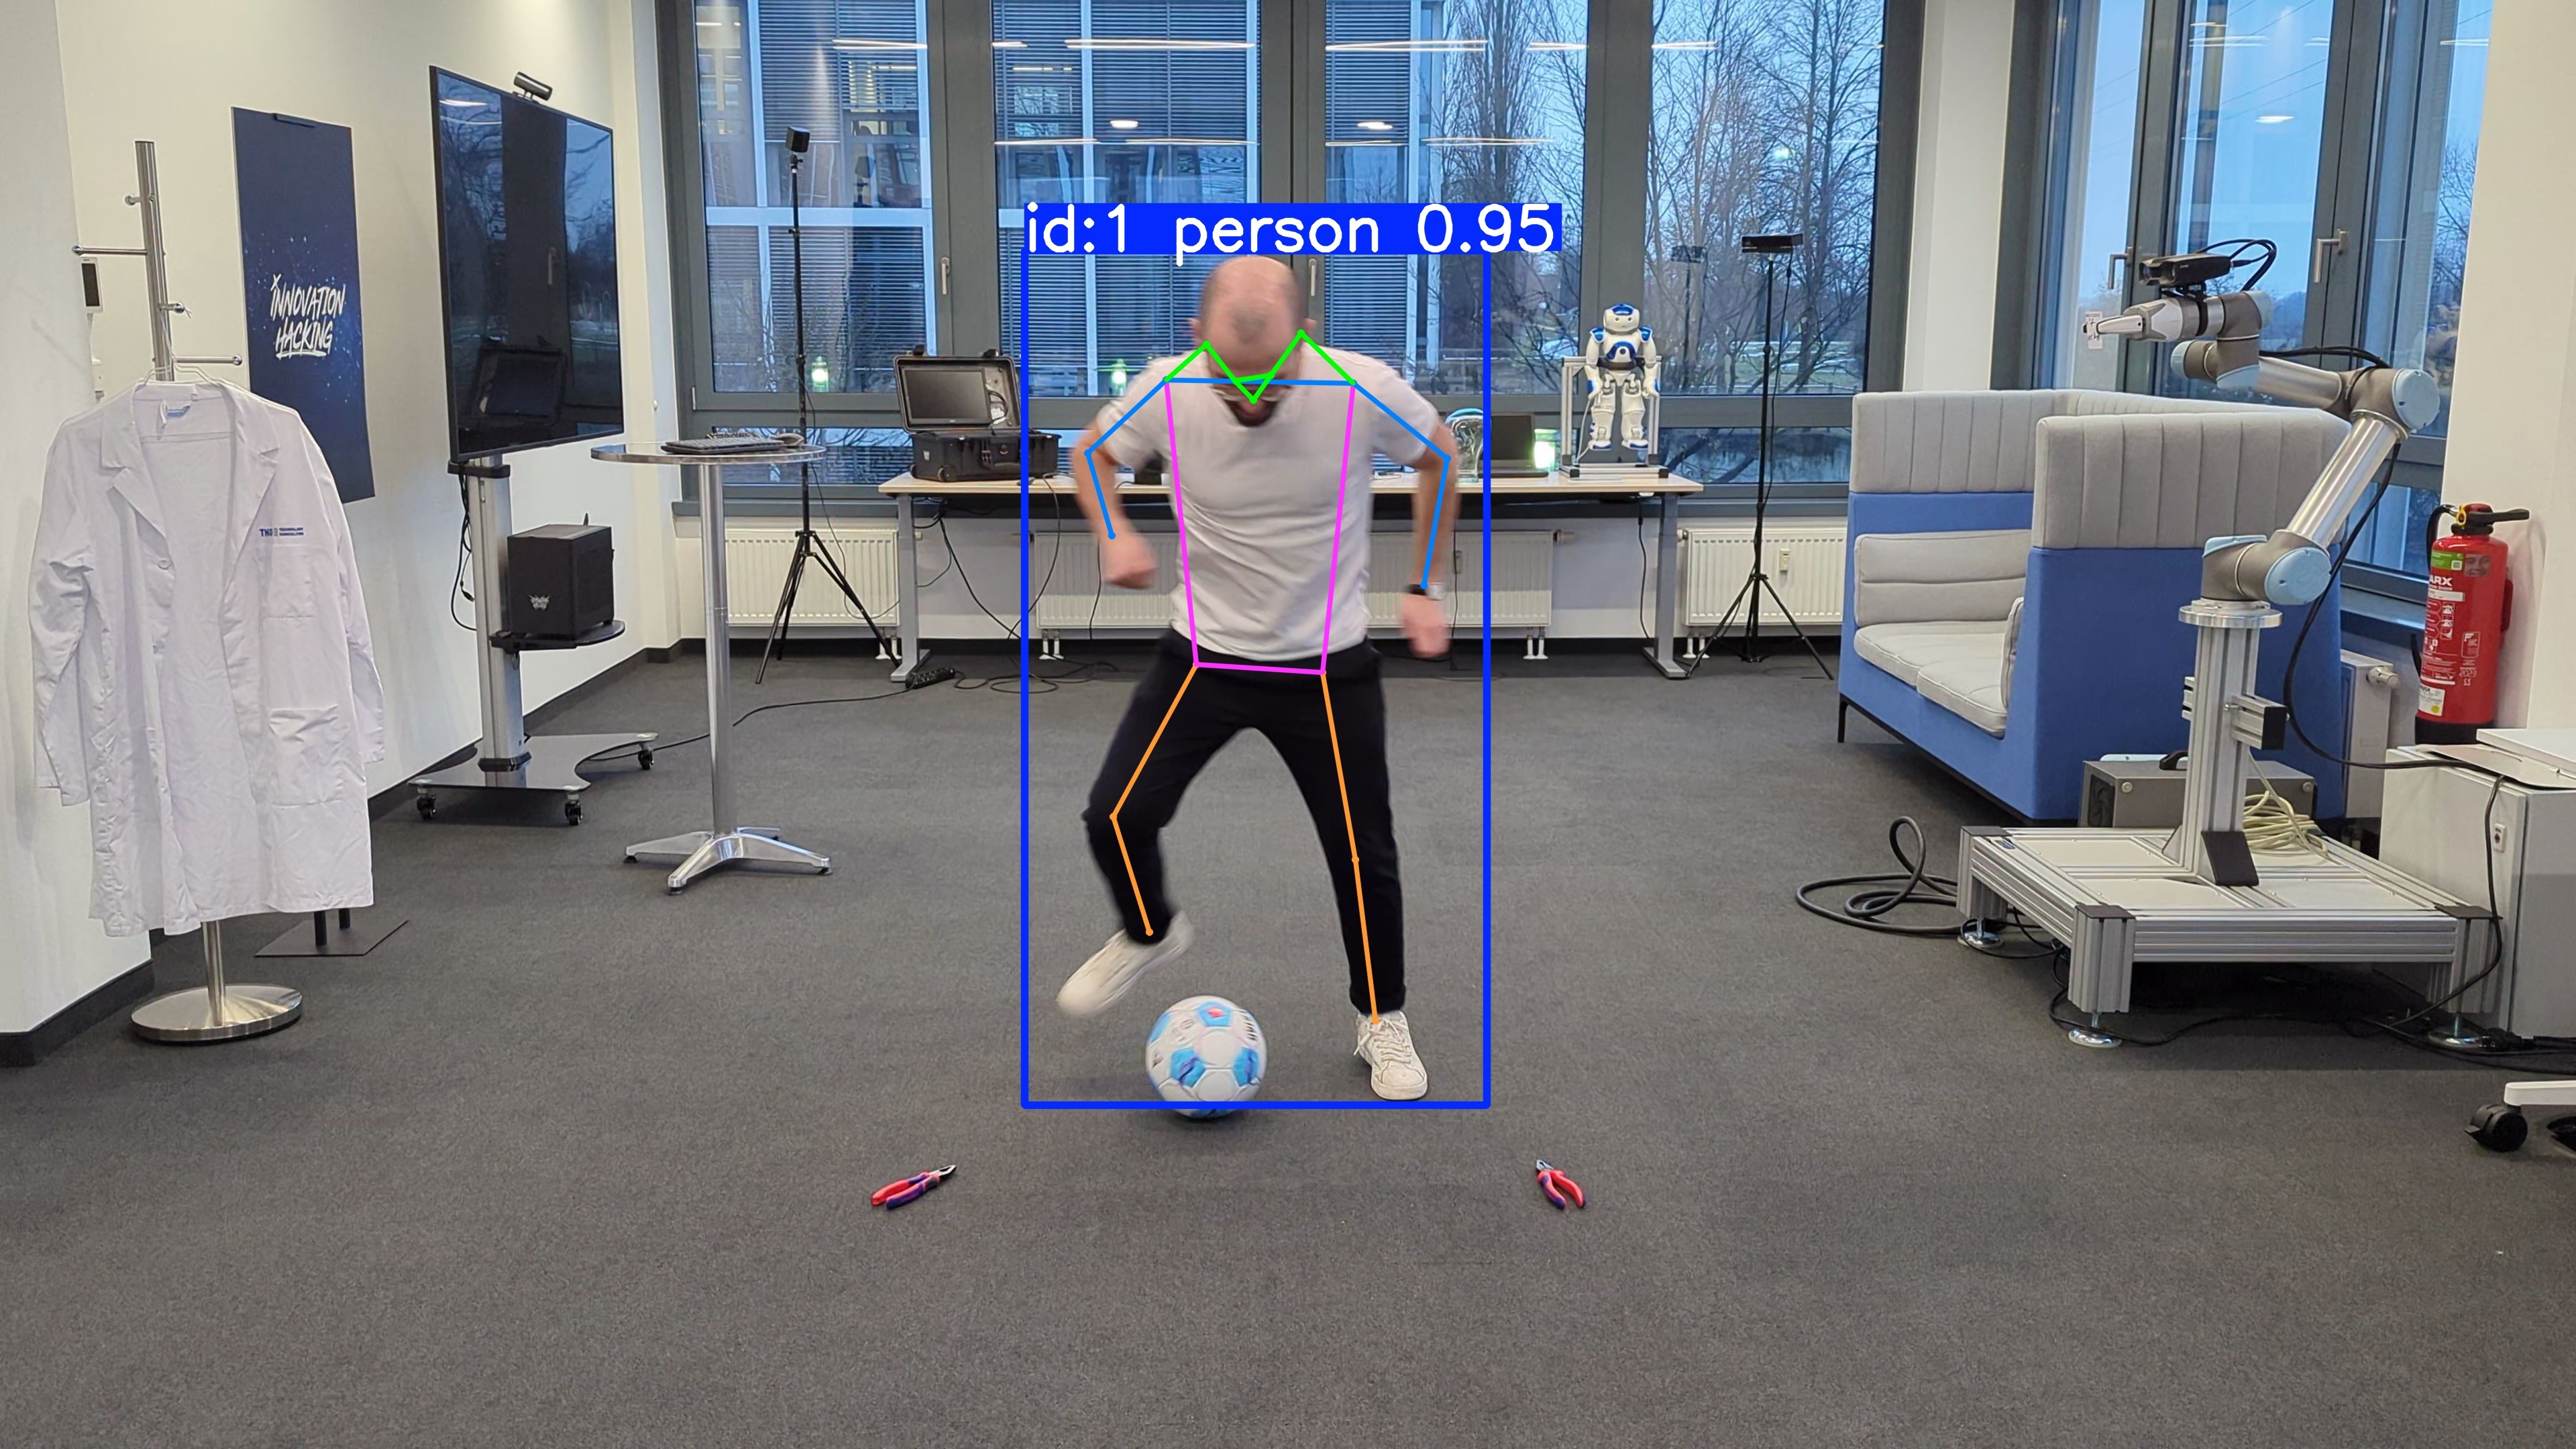
- Detect the athlete in each frame and estimate their pose as 17 key points with yolo11-pose. These key points define basic skeletal information of the athlete and include the position of the head, shoulders, arms and—most interesting for us—the feet.
Next, we preprocess the raw data in a couple of key steps to get reliable world data.
- Data cleaning: Footballs are round, so their bounding boxes should be square, right? Looking at the raw data, we find some detections where the bounding box is an elongated rectangle instead. These are the instances where the football is partly occluded. Calculating positions and speeds from these faulty bounding boxes would be highly inaccurate, so we discard the non-square observations.
- Find the relevant ball: When recording a video on a football field, it’s easy to run into the situation where there are more than one football in the shot. For this reason, we have to to distinguish the ball used for performing the drill from other balls that may be lying around in the background. Using the assumption that the relevant ball is most likely in movement most of the time and also closest to the camera, we select the ball with the highest screen-space velocity. In practice, this implies calculating average speeds for all detected ball trajectories, selecting the fastest non-overlapping trajectories and merging them into one.
- Interpolate missing data: Through occlusions, the ball might not have been fully visible in all frames. To fill in the missing data, we use cubic interpolation to calculate the ball’s position at any point on the trajectory.


- Calculate Real-World Sizes, Speeds and Accelerations: When conceptualising the scores, we quickly realised that a lot of them would be dependent on real-world sizes, speeds and accelerations. It turns out footballs are standardised in size, which makes it really easy to estimate real-world sizes, at least in 2D screen space, which is good enough for our use case. Since we have a full trajectory of ball positions and sizes, we can easily calculate time-discrete speeds as v(t)=p(t+Δt)−p(t)Δt where p(t)=(px(t),py(t))⊤ is the postion at time t and Δt is the time difference between two frames. With this method, we can also compute accelerations at any point in time.
With this cleaned world data, it’s time to calculate scores. After consulting with the domain experts—among which is a former Bundesliga player—and looking at a selection of good and bad video examples, we identified four key performance indicators when executing the Elastico Tip-Tap drill. For each of these, we created a corresponding score and tuned them to correlate with human perception.
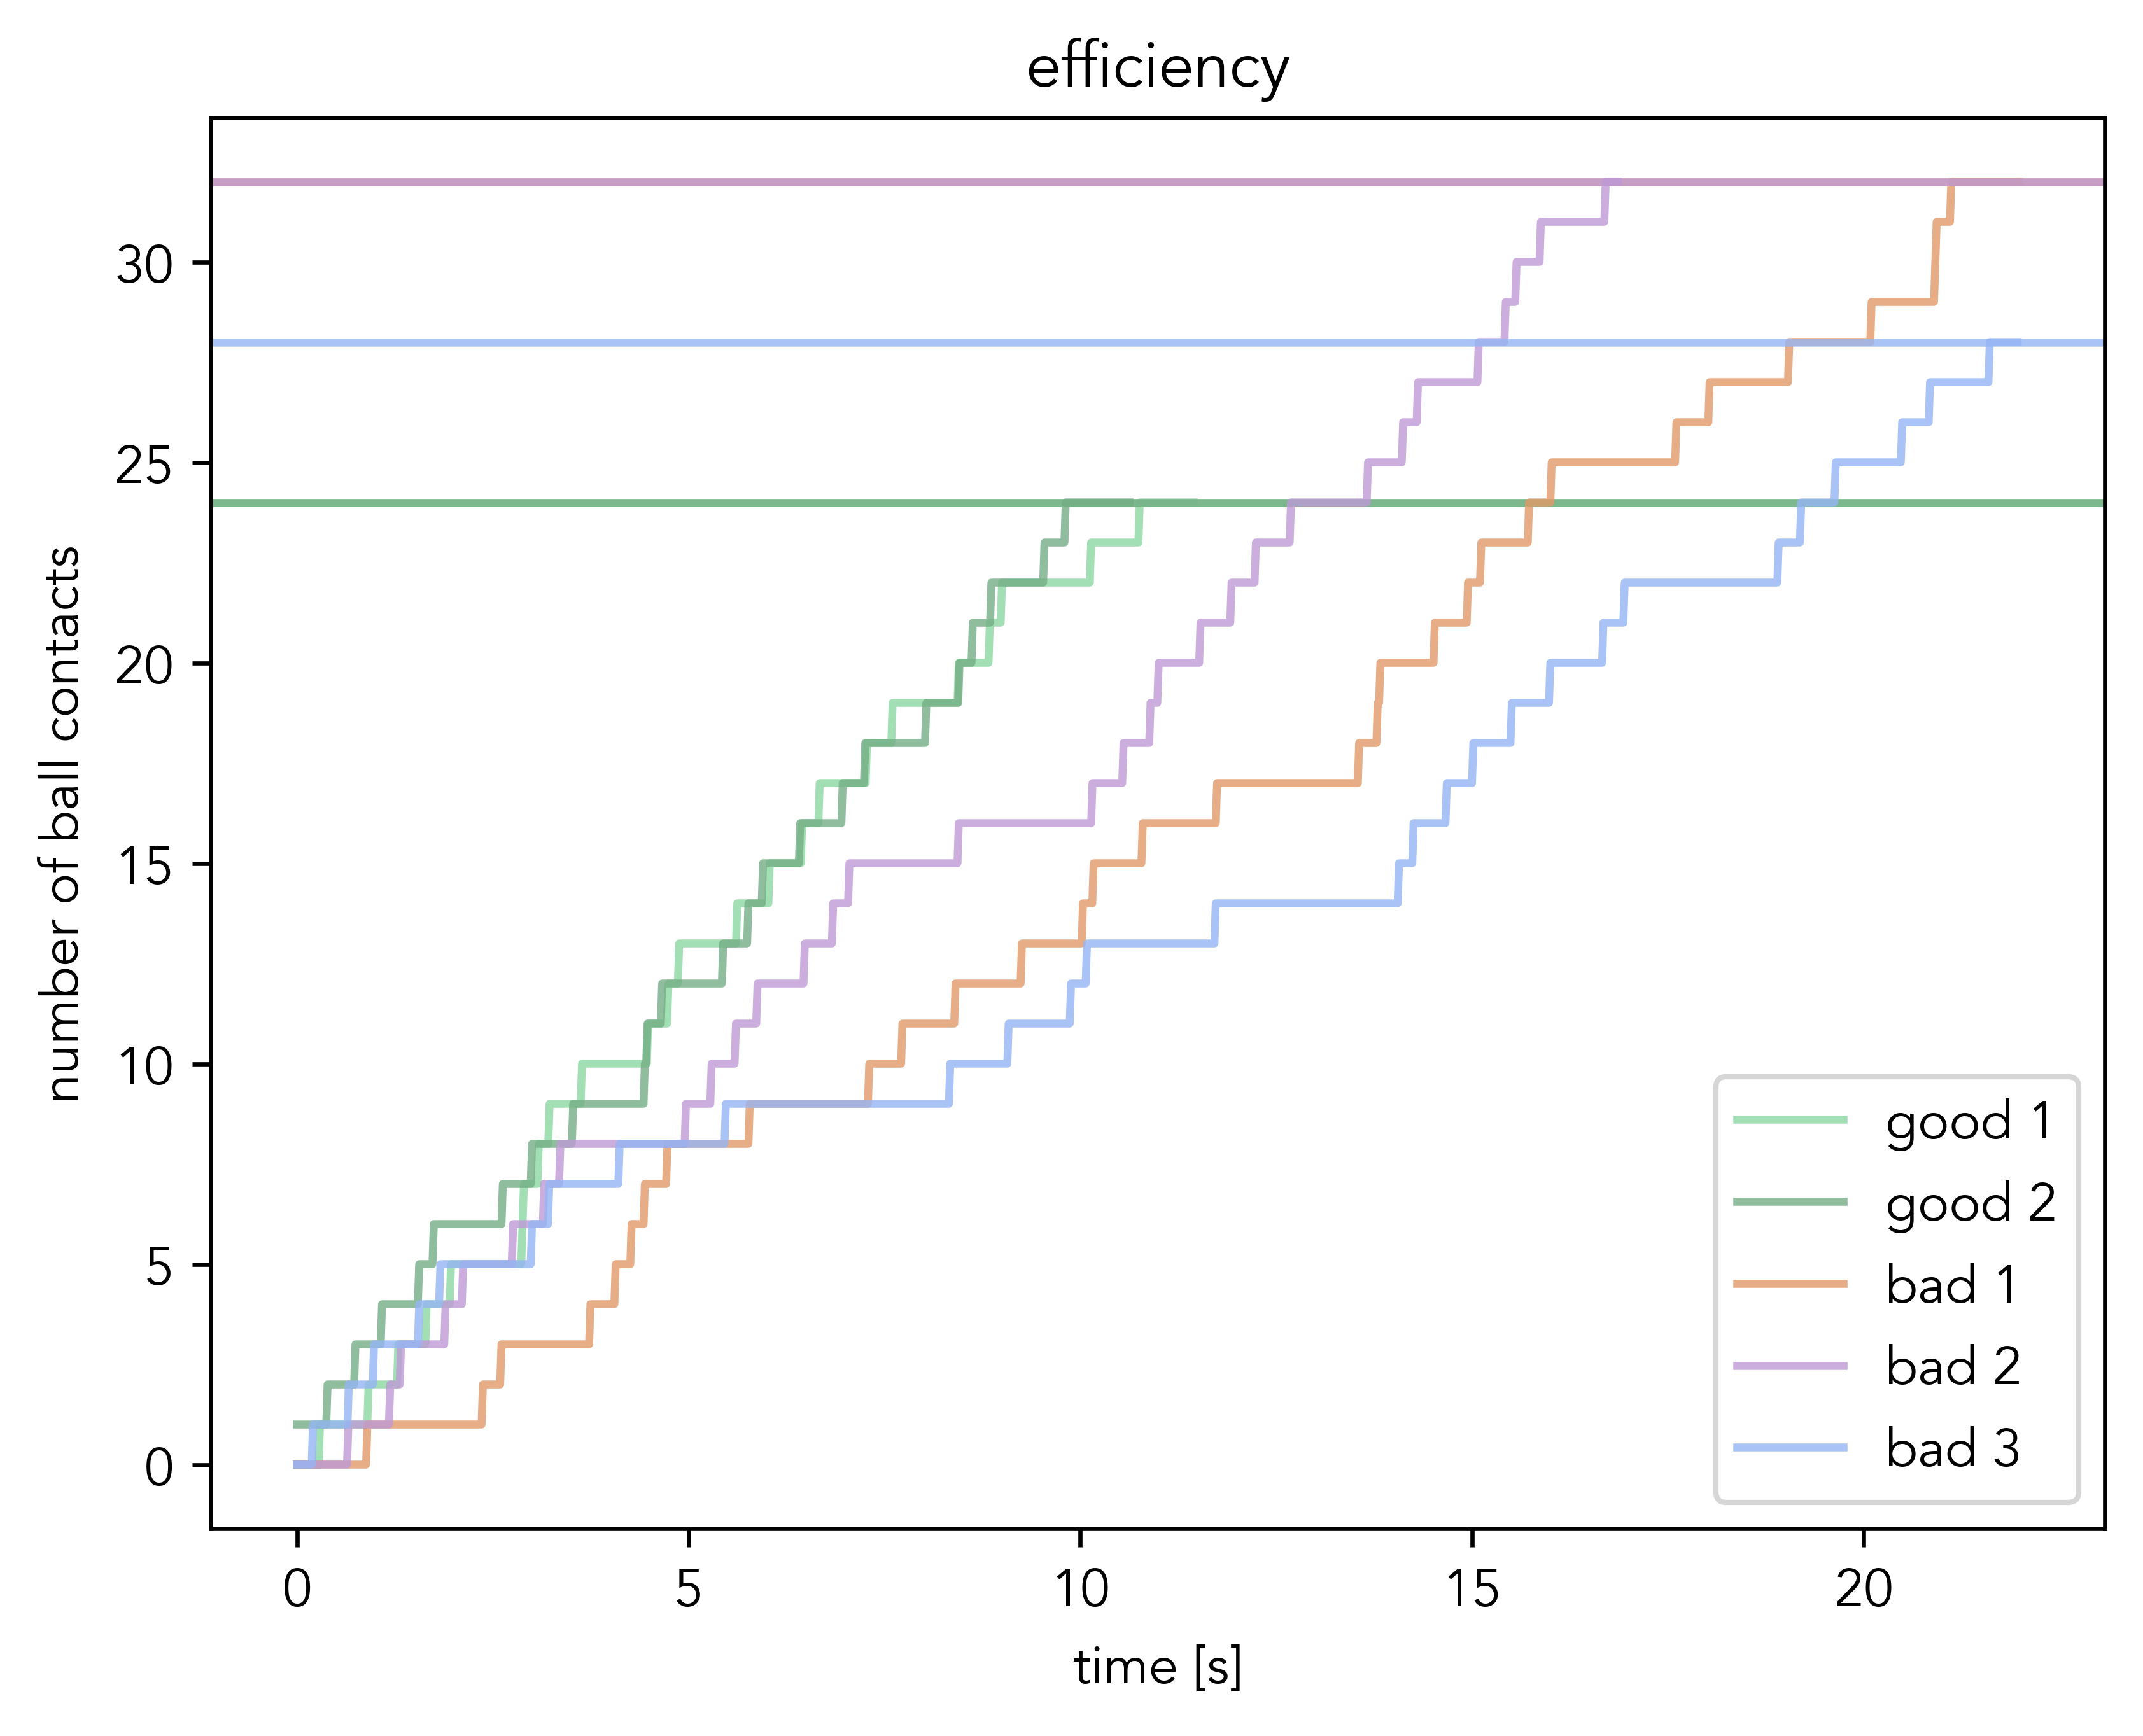
Efficiency
We detect ball contacts by finding frames where a foot is sufficiently close to the ball (we found that 15cm is a reasonable threshold). To filter out observations where the foot passes behind or in front of the ball without touching it, we also check if acceleration of the ball is sufficiently high (we found that 6m/s² is a reasonable threshold). This way, we get all the all ball contacts that changed the movement of the ball.
Below, you can see how good and bad execution differs in ball contacts and how they come in over time.
Control
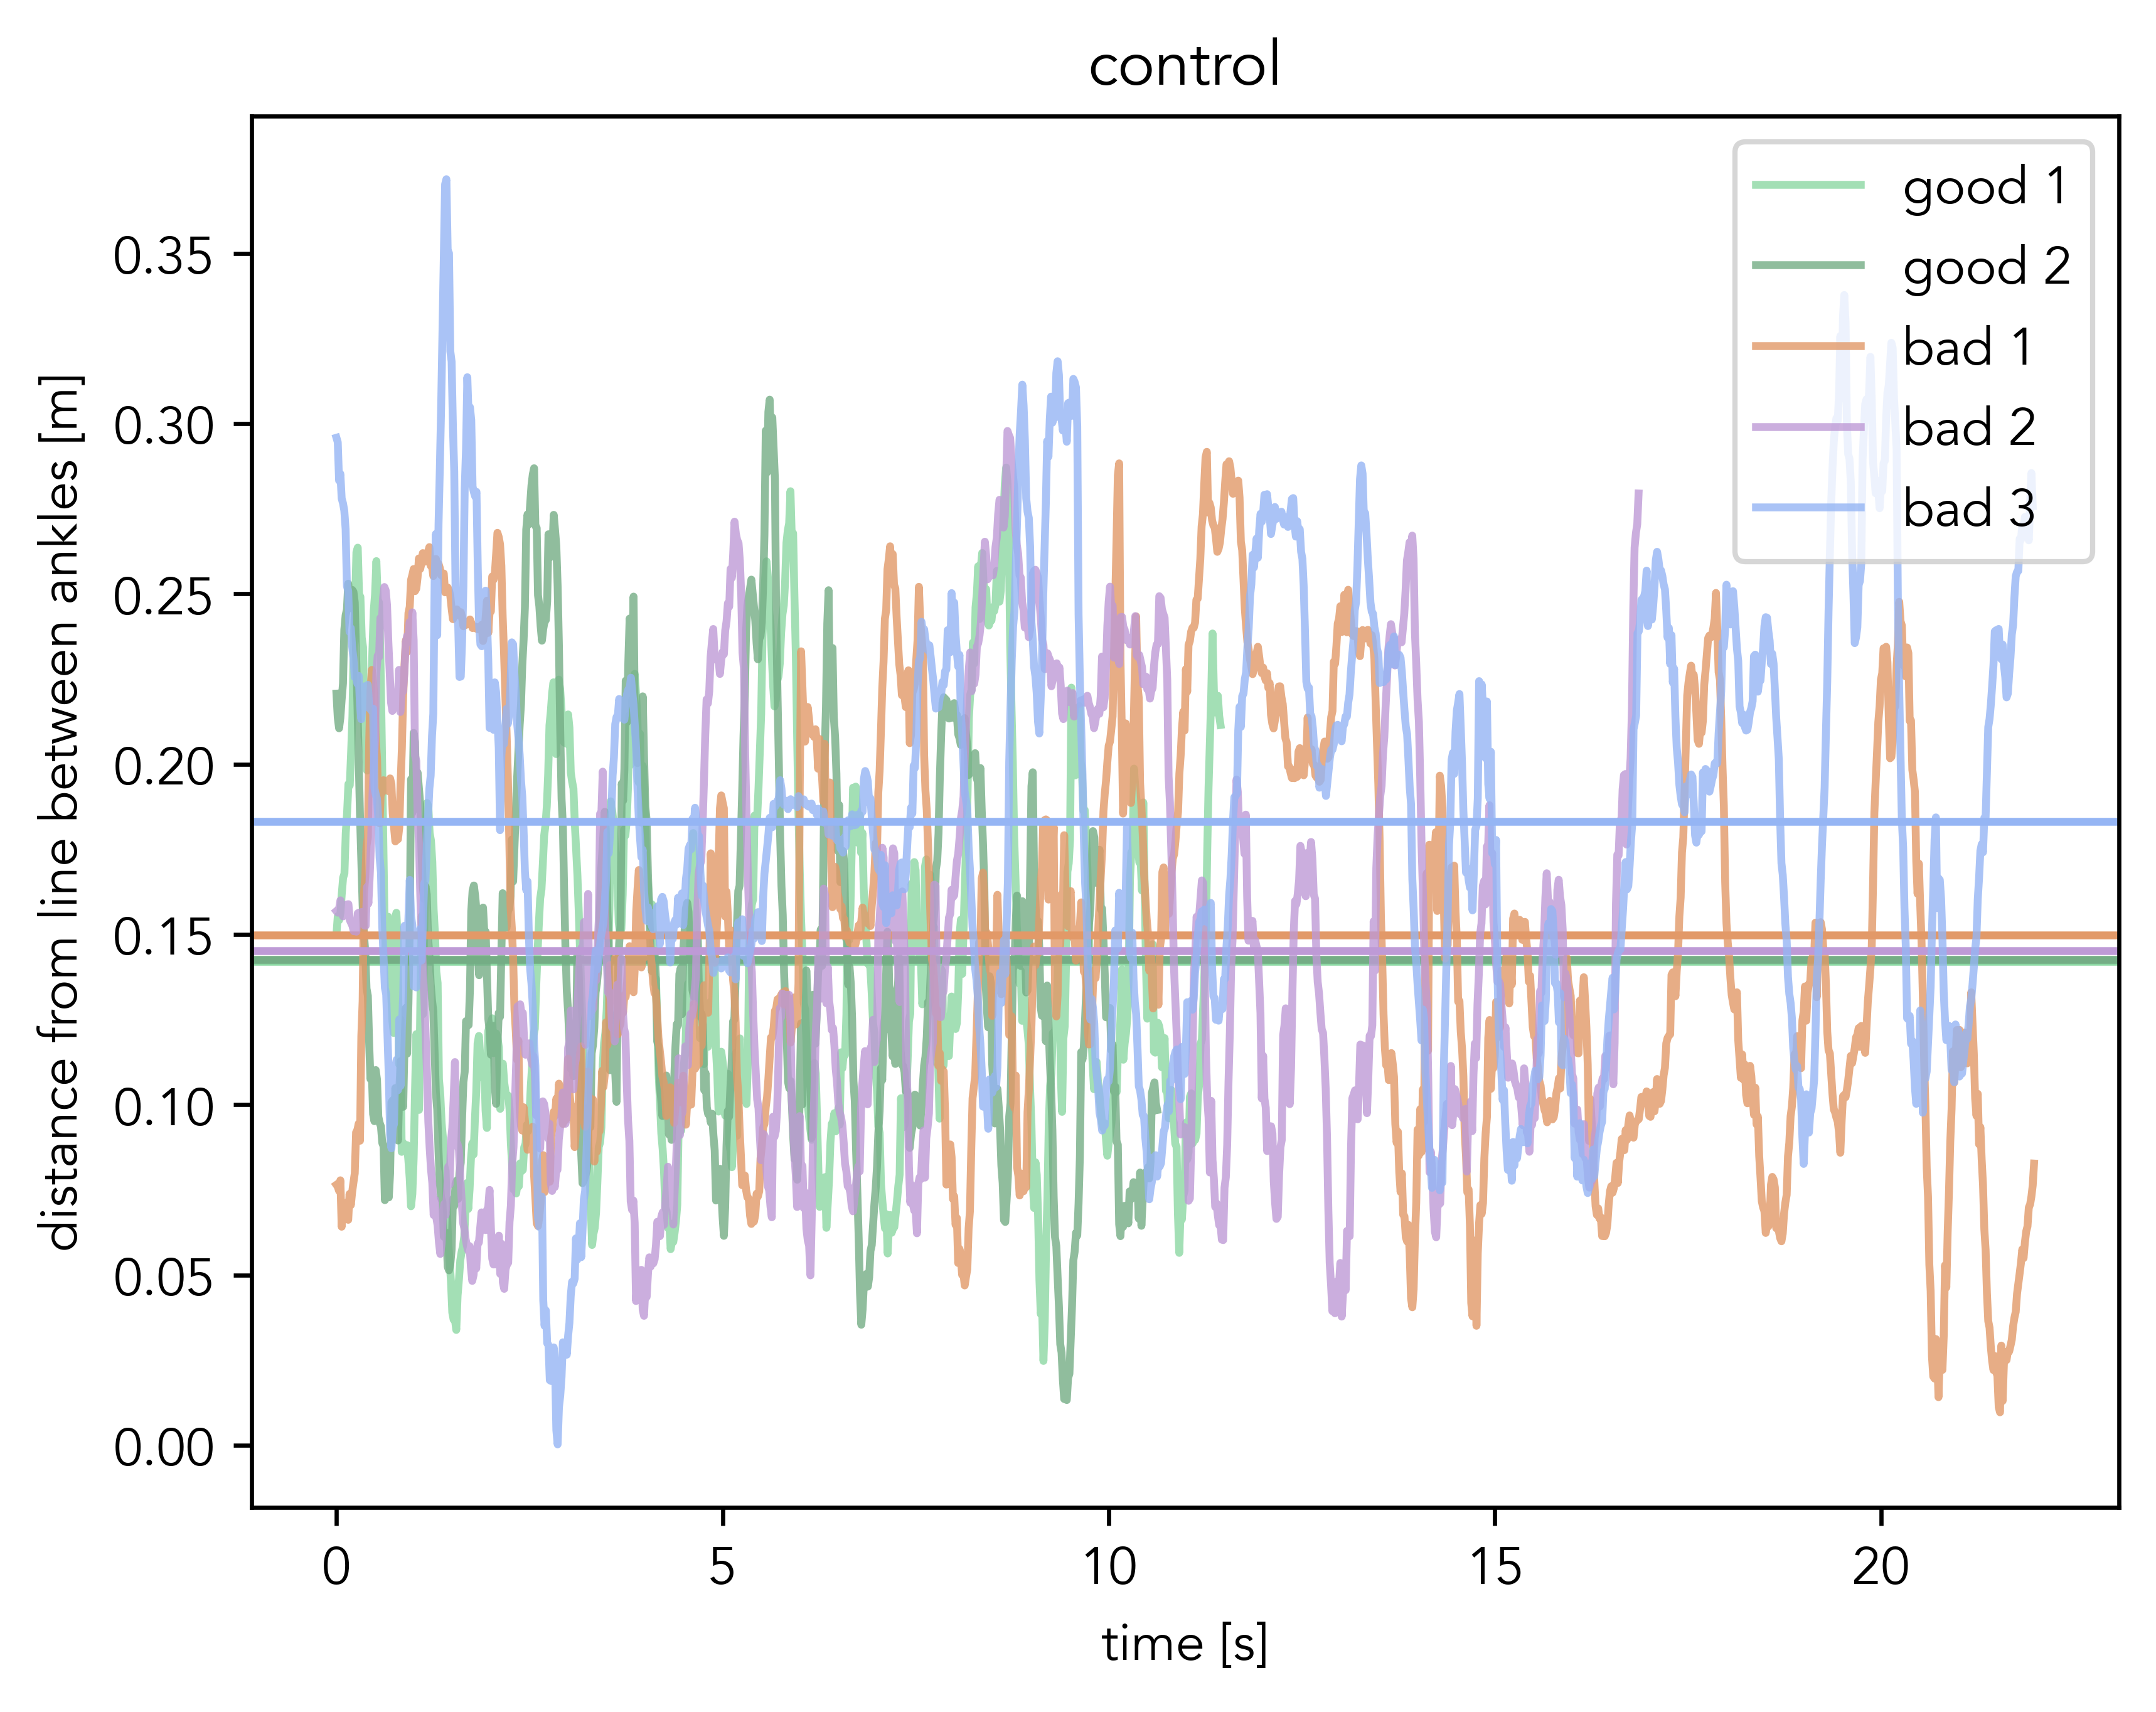
On the football pitch, moves like the Elastico Tip-Tap are required to dribble and outmaneuver opponents, so keeping good control over the ball is crucial. We measure control as the distance to the ball. The closer, the better!
Here, we need to differentiate:
- If the ball is outside of the legs: the ball should be really close to the feet. So, the distance to the closest foot should be minimal.
- If the ball is between the legs: Ideally, the ball should be around the center of gravity, so somewhere on the line between the feet. We penalise the distance to the ideal line. Averaging over the entire video gives us an average distance to the ball. Down below, you can see the distances for the five runs; the straight lines are the respective averages. Bad 3 is an interesting example that was special due to it’s extreme sloppiness in control.
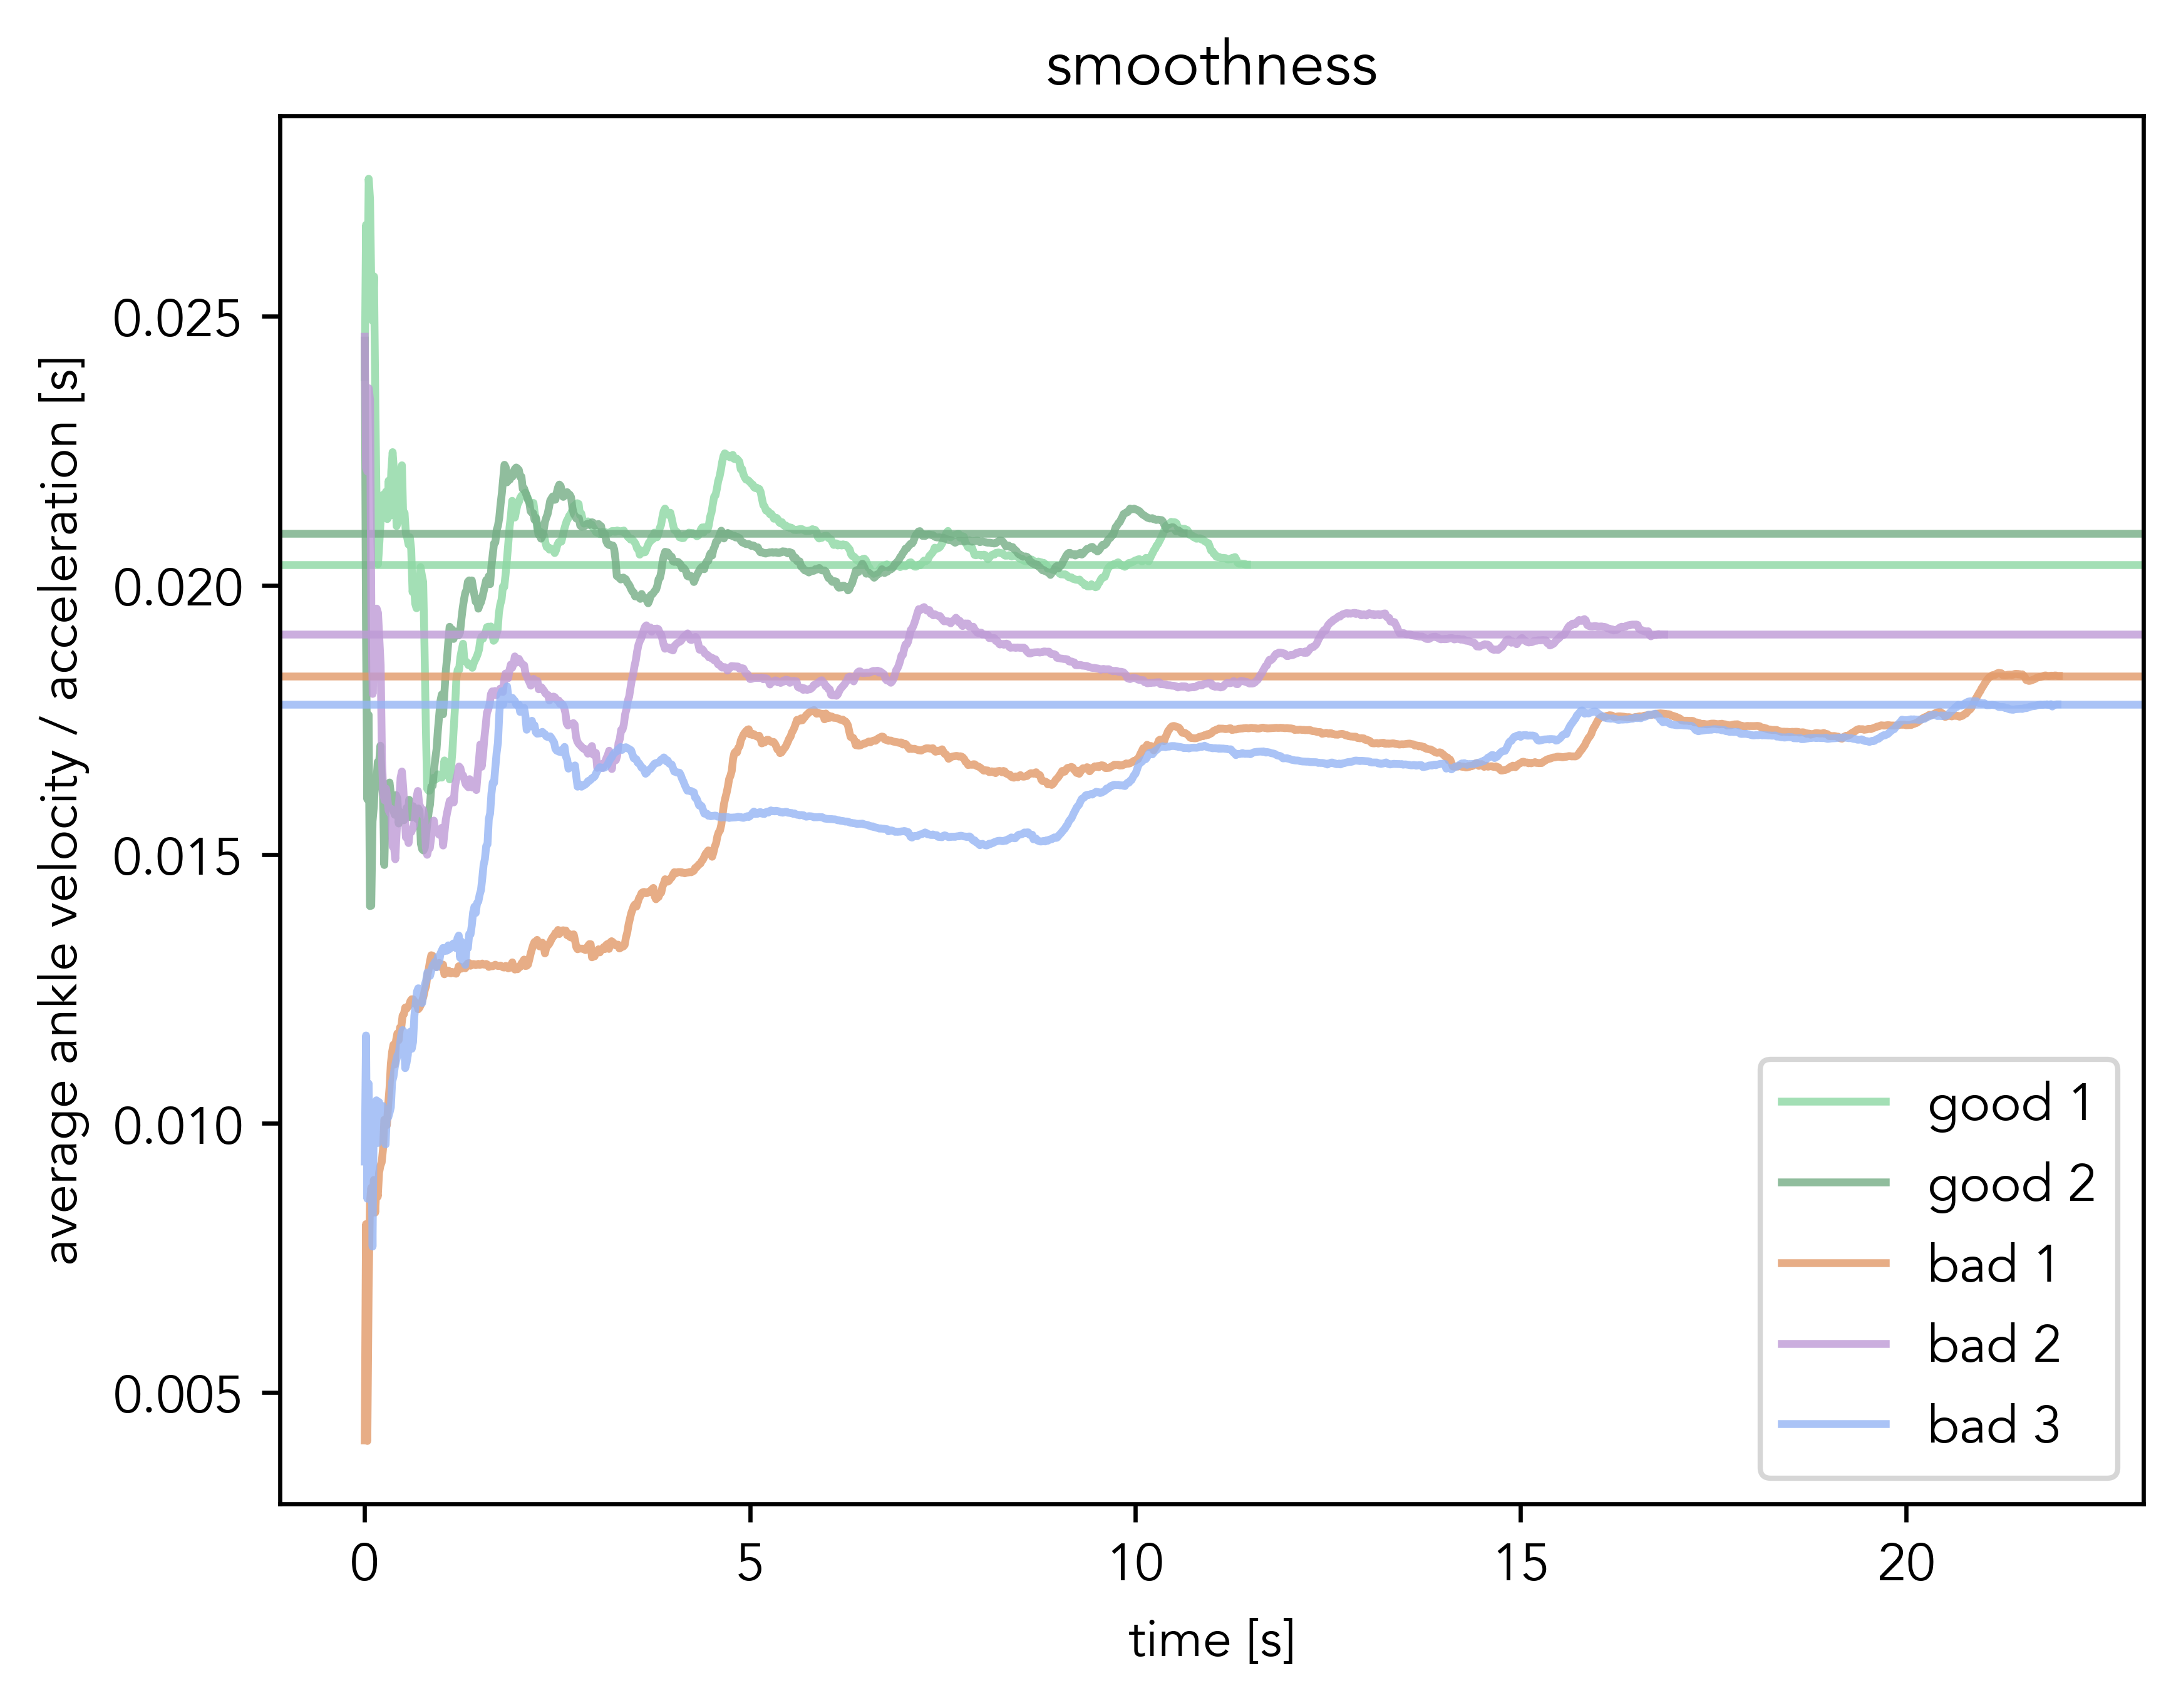
Smoothness
How smooth are your moves? Are you connecting your ball contacts with flowy motions or are you twitching a lot without actually getting too far? Low smoothness makes you look less cool and leads to faster fatigue, so the smoother, the better.
We define smoothness as minimal foot acceleration for maximum foot velocity. Mathematically, we calculate the average norm of the velocity over time ⟨v⟩ and average norm of the acceleration over time ⟨a⟩ of both ankles. Then, we calculate a measure of smoothness as ⟨v⟩⟨a⟩ averaged over both ankles.
Below, you can see a rolling average of smoothness over time for the different runs.
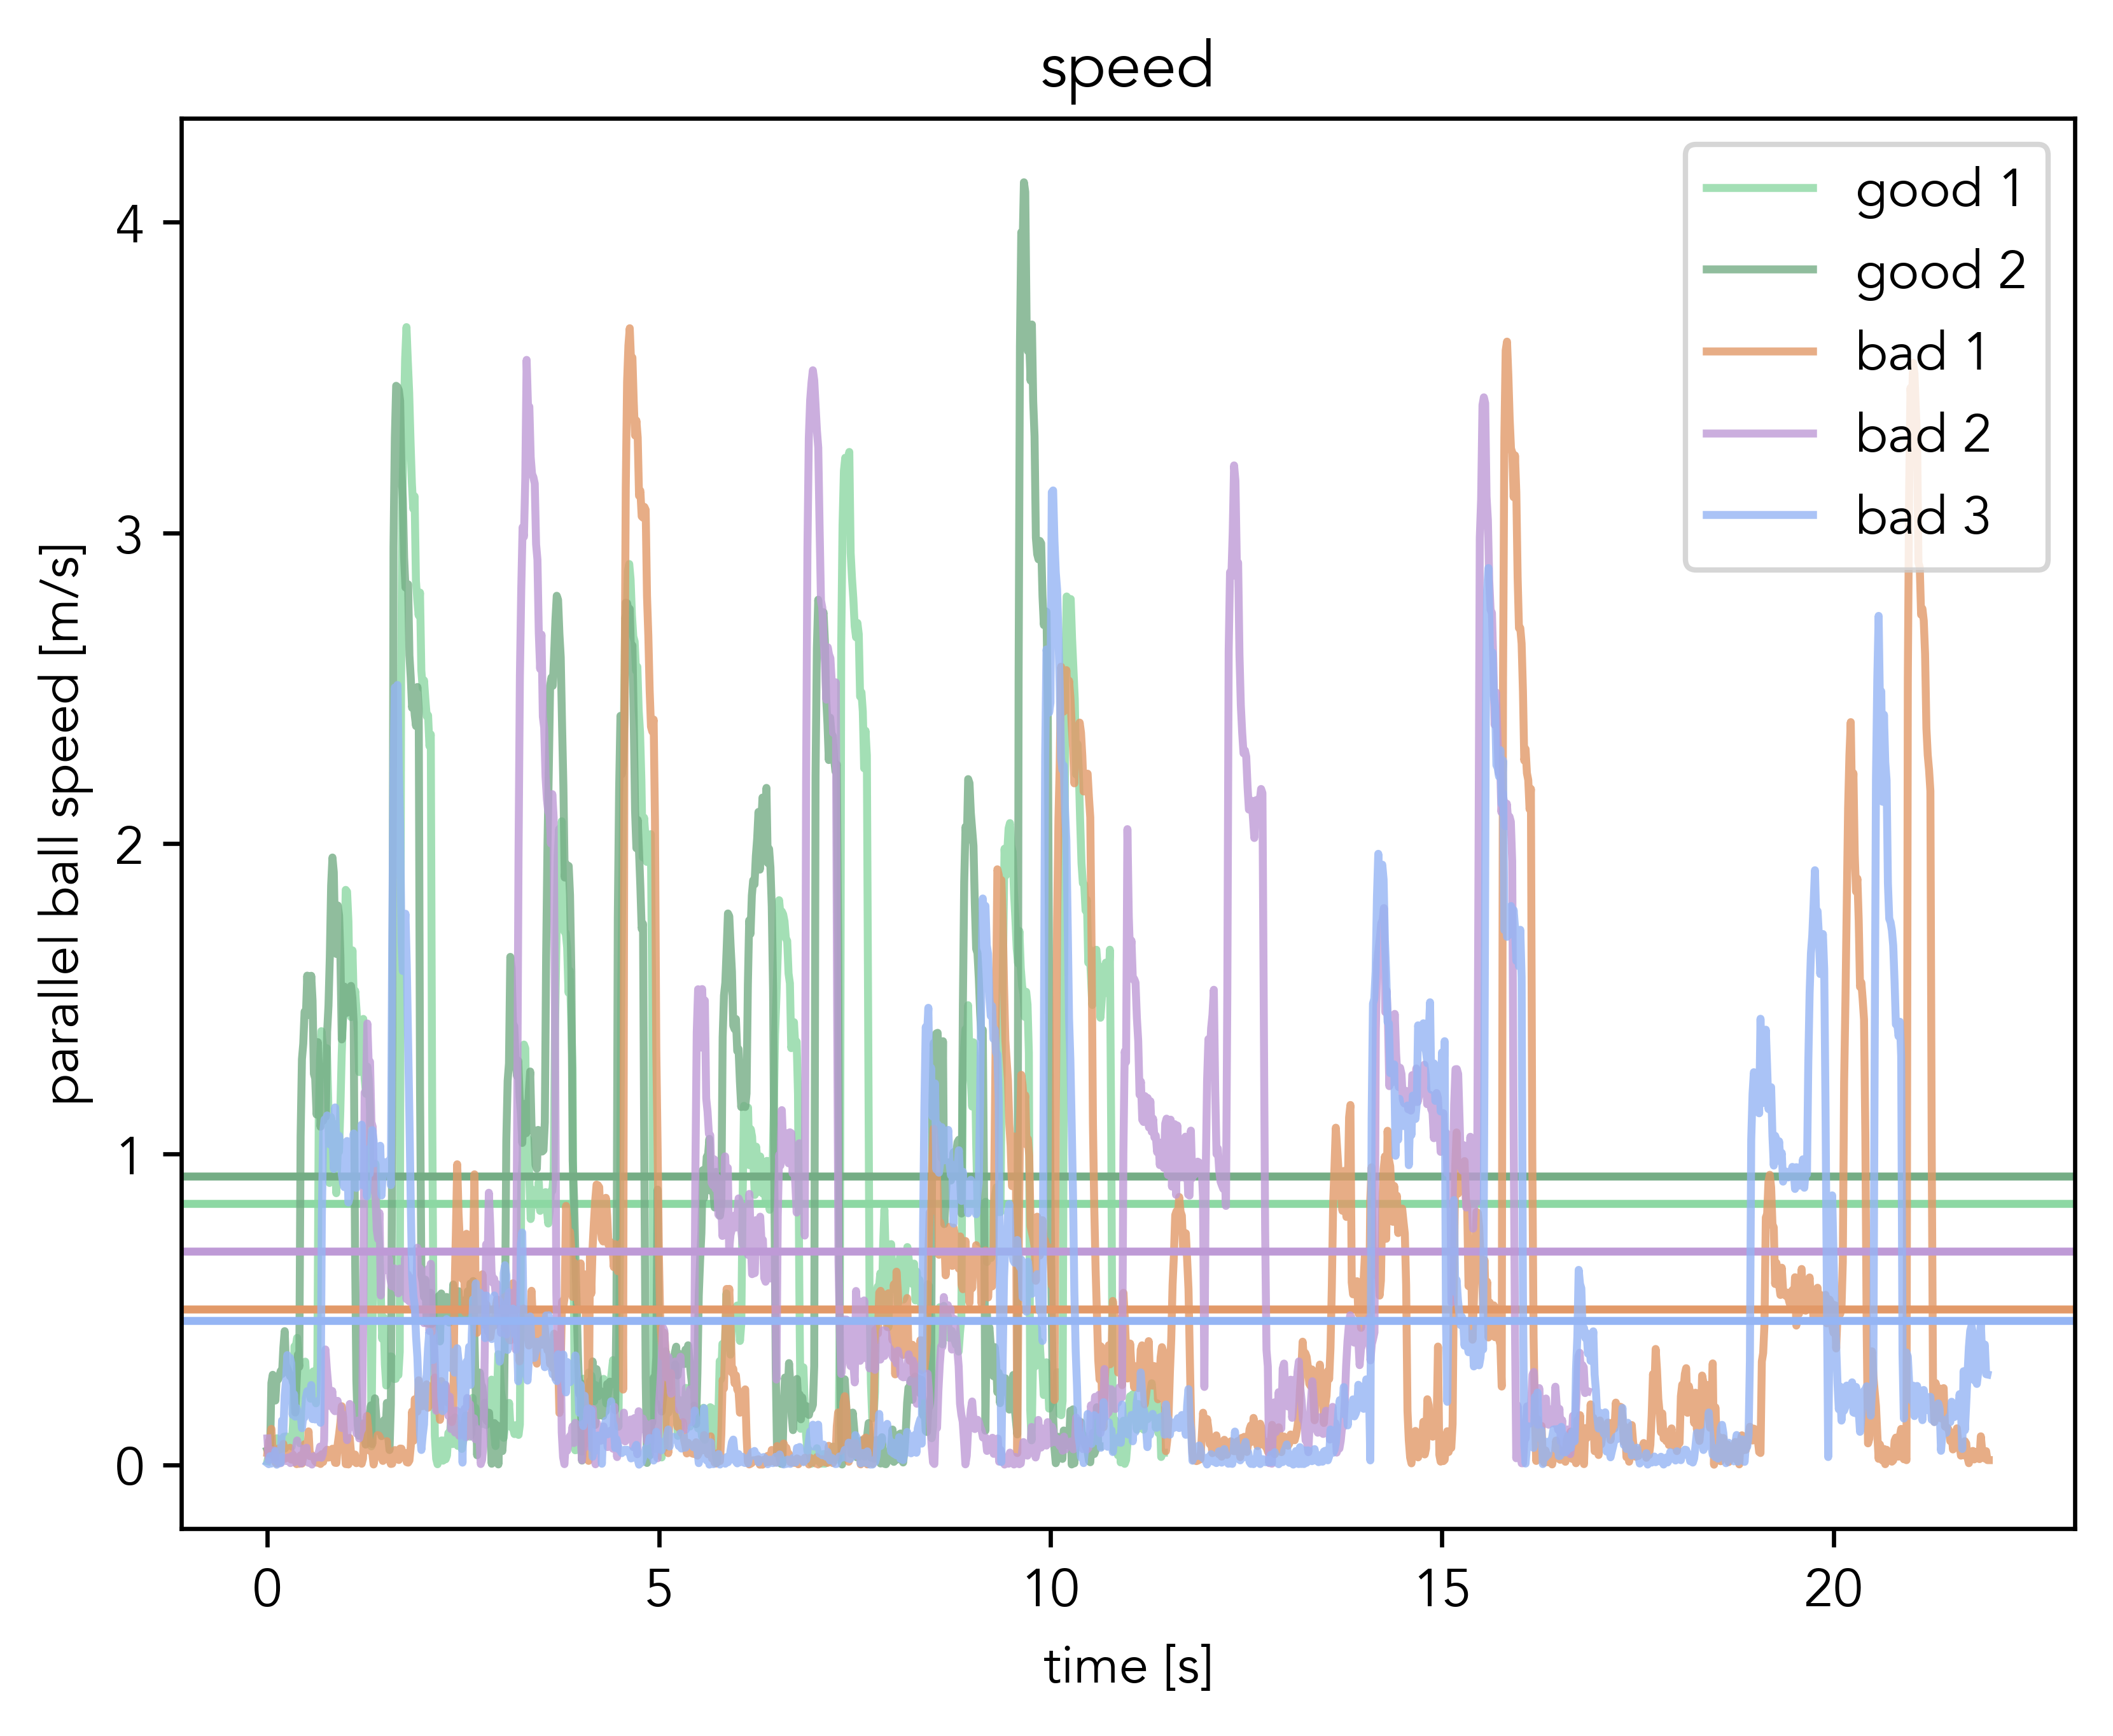
Speed
The faster you finish the drill, the better. Here, we could have just measured the time from start to finish of the drill. However, for this PoC, we didn’t implement a detection whether the exercise was started or finished, so we use the average horizontal ball speed as a proxy instead. The faster, the better.
Below, you can see speed over time for the different runs. The vertical line indicates the average speed.
Final Score Values and Overall
For each of the performance indicators, we empirically choose parameters to map the raw metric value to a score between 0 and 10 such that they align with our data. For example, the Elastico Tip-Tap ideally requires around 24 ball contacts, yielding a 10/10. 30+ ball contacts are pretty bad and are ranked as 0/10.
Finally, the scores are averaged to an overall score.
Future Work
- Detecting Start, Stop and Correctness of Drill: In its current form, we do not detect whether the drill was actually performed successfully. We assume that it was, and only rank the “goodness” of the performance. The missing piece here is being able to detect the cones. Cones are not one of the classes that YOLO11 can detect out of the box, so this would require a fine-tune on custom data. With a reliable cone detection, we could both check when a drill is started or stopped and whether the ball is being moved around the cones correctly.
- Diversification of Drills: For the first version, we settled on the Elastico Tip-Tap. Generally, our approach can be extended to cover a wide variety of drills.
- Live Video Feed Analysis: While the underlying computer vision model is optimised for real-time applications, our pipeline runs as a post-processing step. Being able to provide real-time feedback to the athlete would greatly benefit the user experience.
- YOLO License Compliance: YOLO11 ships with an AGPL license, making it a pain to work with in production scenario. Switching to a different object detector or extracting the YOLO parts to a seperate service that can be open sourced is something that would need to happen for a production version.